
Market Research
Inside Amazon AVNs: What Separated Winners from Losers (2026 Study)
 Written by Martin HeubelUpdated 02 Sept 2026
Annual Vendor Negotiations (AVNs) keep sending shivers down the spines of sales teams worldwide. After analysing the survey results from hundreds of suppliers, it's easy to see why.
Amazon's $200bn+ investment in AI infrastructure has left its mark on its retail division. Today, Vendor Managers seem more focused on margins and less partnership-oriented than ever before.
At the same time, brands are facing mounting macroeconomic pressures, from rising oil prices to higher shipping costs. The stakes for securing profitable growth during AVNs have never been higher.
So together with market research firm Stratably, I set out to understand how the 2026 AVN cycle went. Specifically, we wanted to explore what separated vendors that protected and grew their margins from those that didn't.
The results are in.
And today, I'm going to share them with you.
Summary of key findings
- Most brands are highly dependent on Amazon: 1 in 3 vendors now generate 60%+ of their online sales through Amazon, and 2 in 3 vendors say Amazon grows faster than any other retailer.
- Channel dependency did not decide the AVN outcome: vendors above 60% Amazon exposure kept terms flat as often as those below 30%.
- Amazon's Everyday Essential focus fuels CPG growth: 83% of Consumables vendors see Amazon outpacing other retailers, compared with 52% in Hardlines and 44% in Softlines.
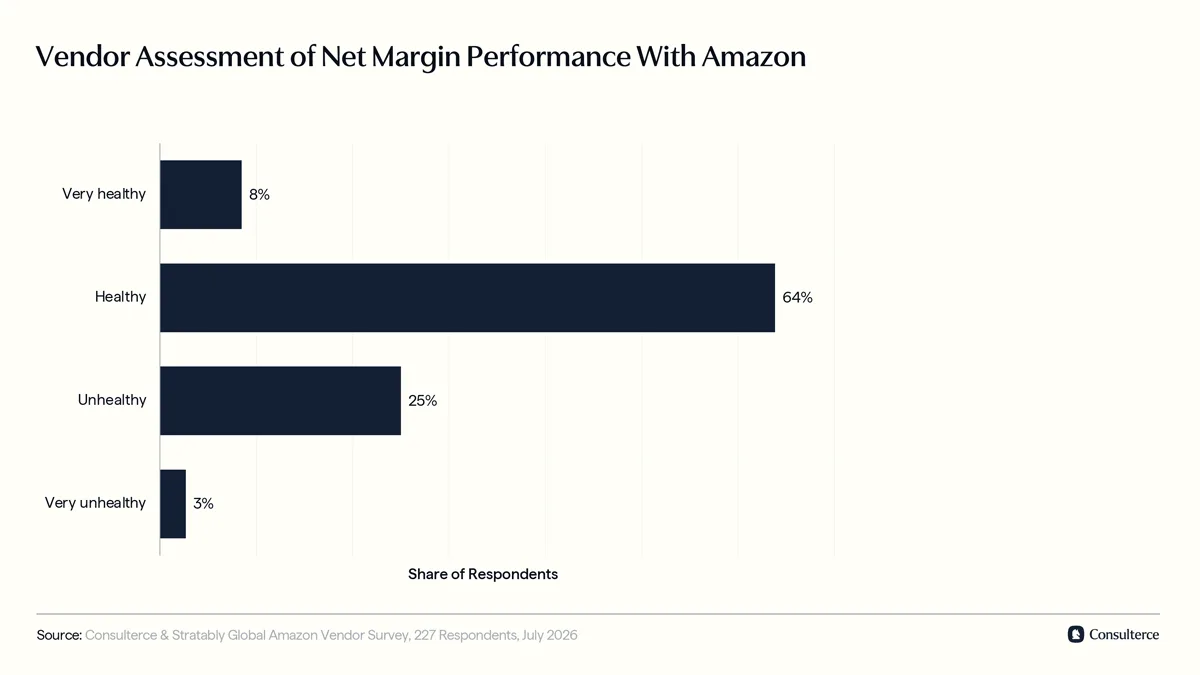
- Despite year-on-year margin compression, most vendors rate their net margins with Amazon as either healthy (64%) or very healthy (8%).
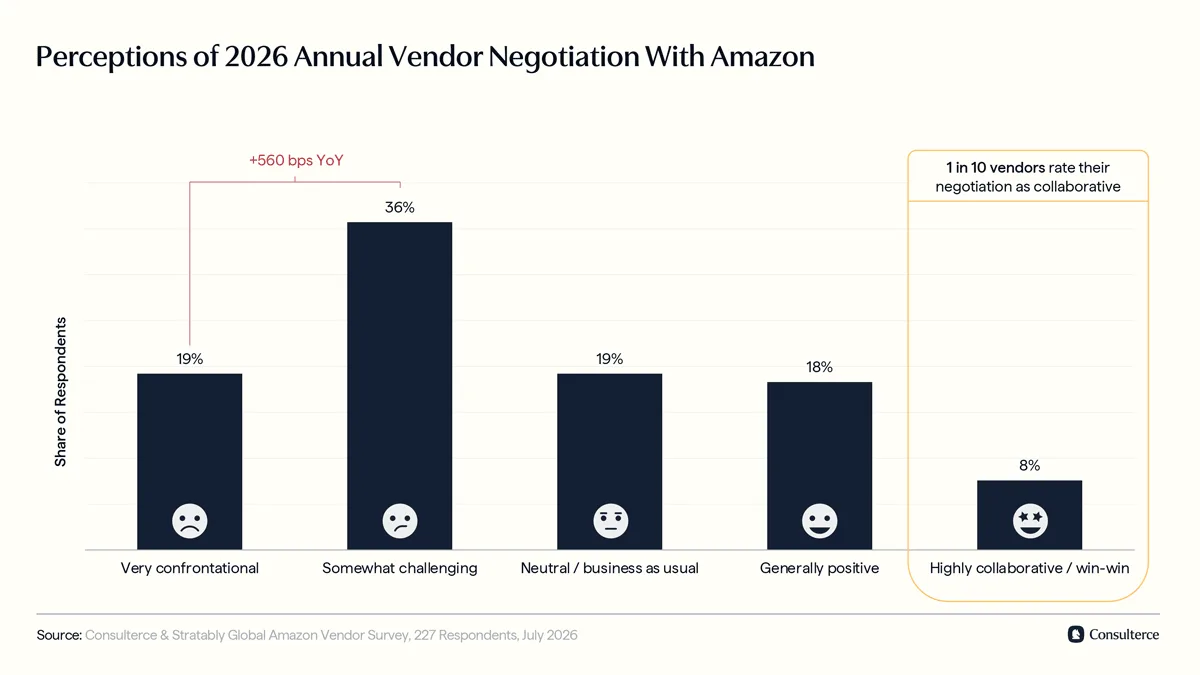
- Negotiations have become more contentious: 55% of vendors describe their 2026 AVN as challenging or confrontational. Only 8% describe them as collaborative.
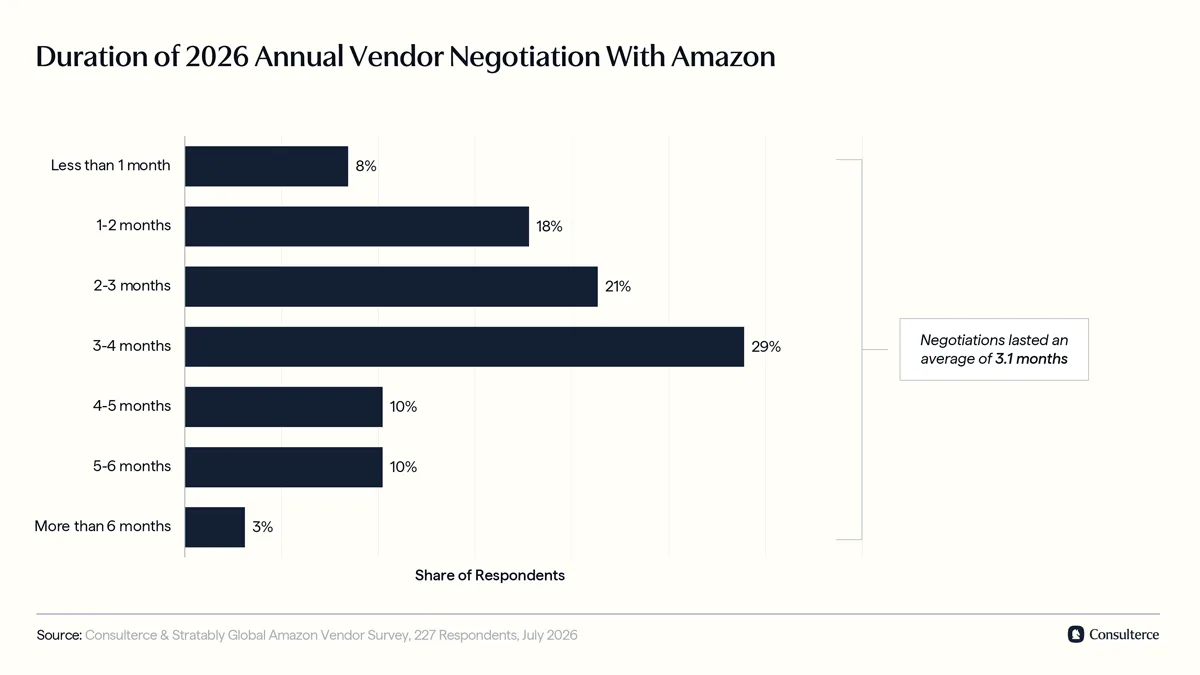
- AVNs now consume a quarter of the year: negotiations averaged 3.1 months (vs 3.2 in 2025), with Hardlines vendors closing fastest and Softlines brands slowest.
- 1 in 2 vendors held the line on trade terms. Brands that conceded gave Amazon +116 bps more terms on average; Hardlines defended best, holding or reducing terms in 60% of cases.
- Vendors secured margin wins through cost prices, not trade terms: terms rose +50 bps on average, while cost prices increased +1.0%, making funding architecture another key success factor.
- Margin winners took two routes: CPG brands took advantage of Amazon's must-stock Essentials focus, while Hardlines won through discipline, with 79% keeping terms flat and 57% securing higher cost prices.
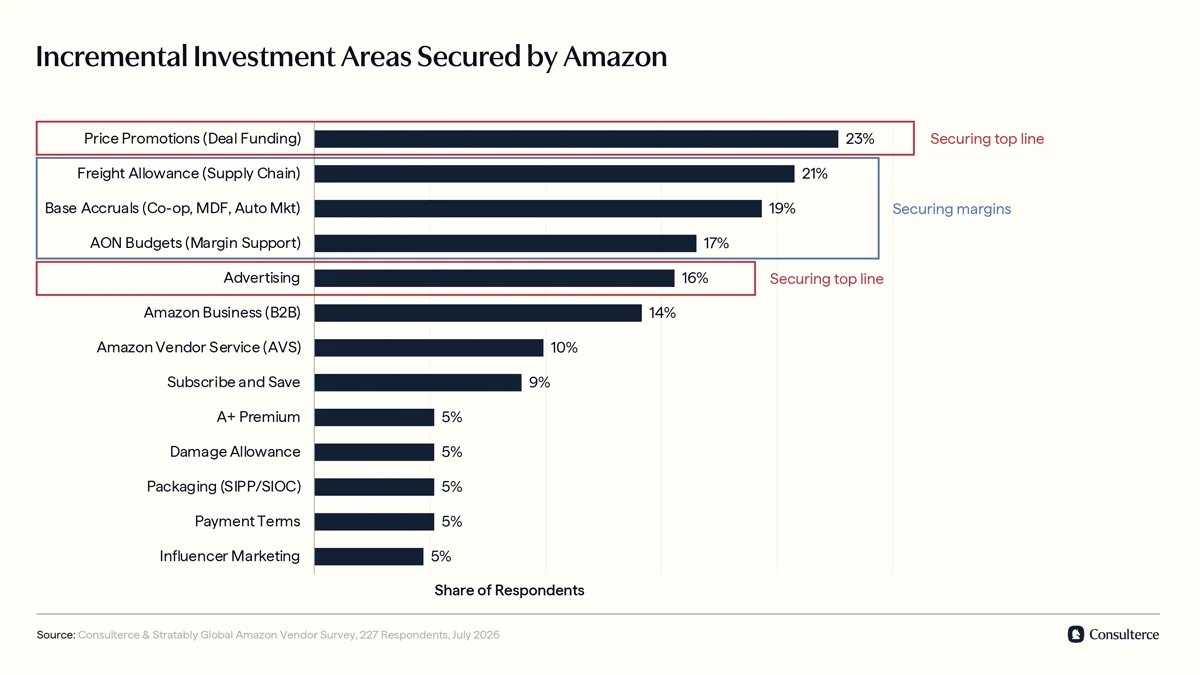
- Vendor Managers focused on deal funding and advertising commitments to secure sales growth, while freight allowances, base accruals, and AON budgets helped Amazon secure margins.
- Higher terms did not buy protection: vendors already spending over 25% of net sales on trade terms conceded again in 73% of cases during 2026 AVNs.
- Punitive measures were widespread: Nearly 1 in 2 vendors faced Buy Box suppressions, making escalation scenarios a core part of Amazon's negotiation playbook.
Vendors cannot grow without Amazon
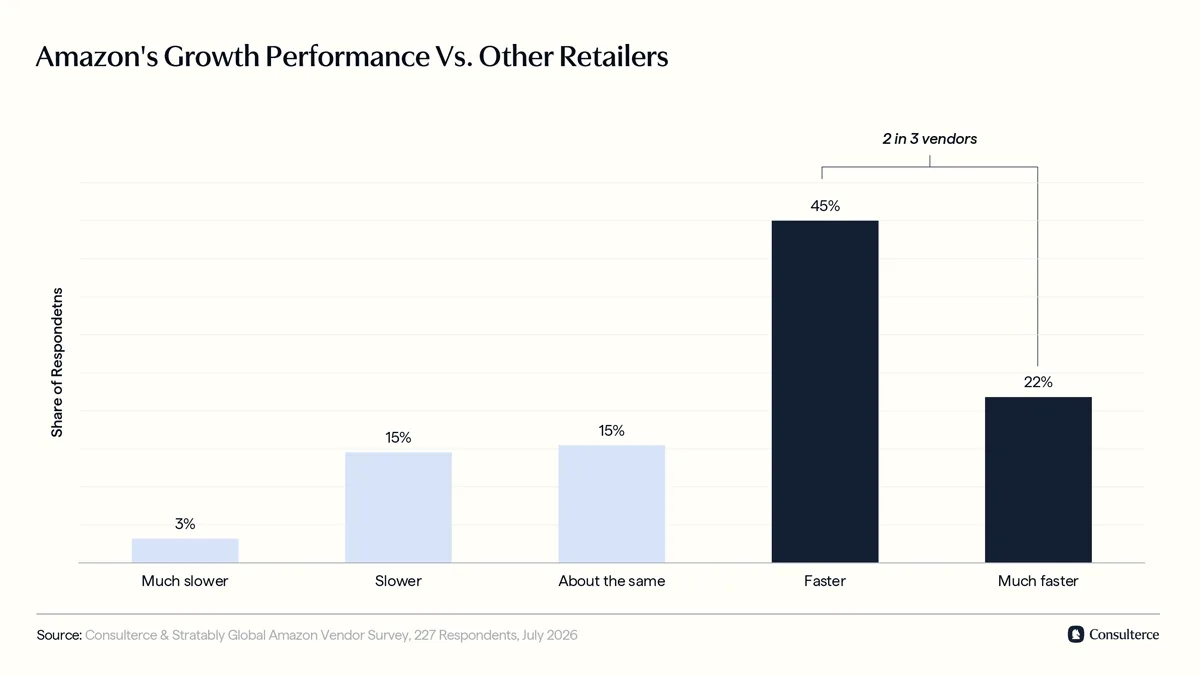
Let's start with the uncomfortable truth: Amazon dominates the online channel. Today, 2 in 3 vendors saw Amazon outgrow every other retailer they work with.
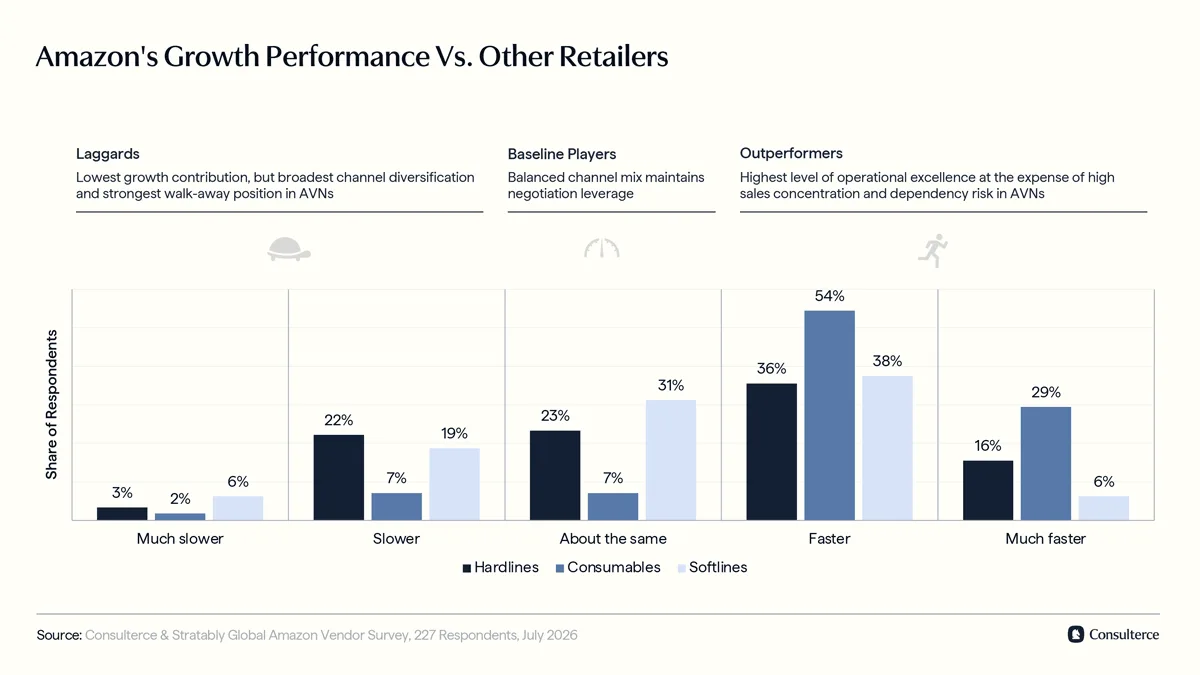
The dependence on Amazon sales growth is particularly evident in CPG categories, where 83% of vendors see Amazon outpacing their other retail partners, followed by 52% of Hardlines, and 44% of Softlines brands.
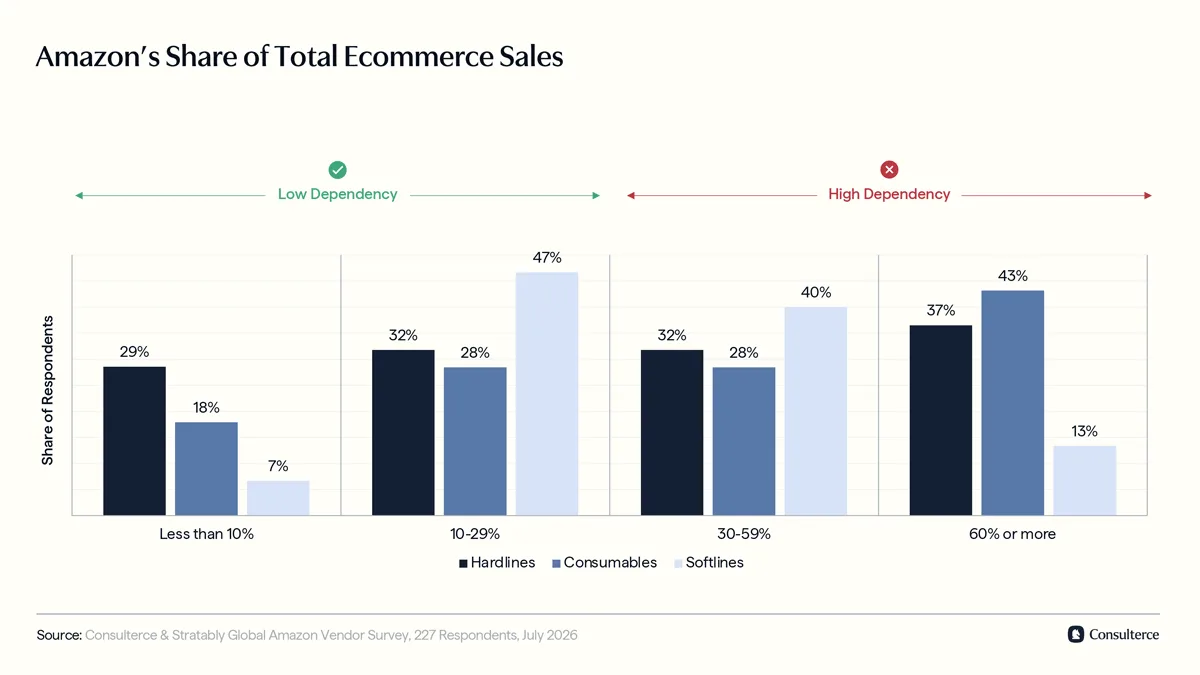
The dynamics start to turn unfavourable for brands when we examine their dependence on Amazon's growth in the wider online channel. 1 in 3 vendors now generate 60% or more of their online sales through Amazon. Another 25% confirm a revenue exposure between 30-59%.
Revenue from Hardlines and Consumables vendors is most concentrated in Amazon, while Softlines brands still benefit from a more diversified distribution setup.
Amazon's strategic bet on high-frequency, replenishable categories has contributed to its recent growth success.
For vendors, it's a tricky dilemma to navigate:
On the one hand, there is a genuine growth story to celebrate. On the other hand, they have few options to resist when Vendor Managers recognise the value of this growth and demand their fair share of compensation during AVNs.
Net margins with Amazon signal P&L resilience
One of the more surprising findings of our research was that 64% of vendors rate their own net margins with Amazon as healthy, and another 8% as very healthy.
Comparing these figures with our AVN study from 2025, there's a noticeable shift from previously considered unhealthy net margins with Amazon.
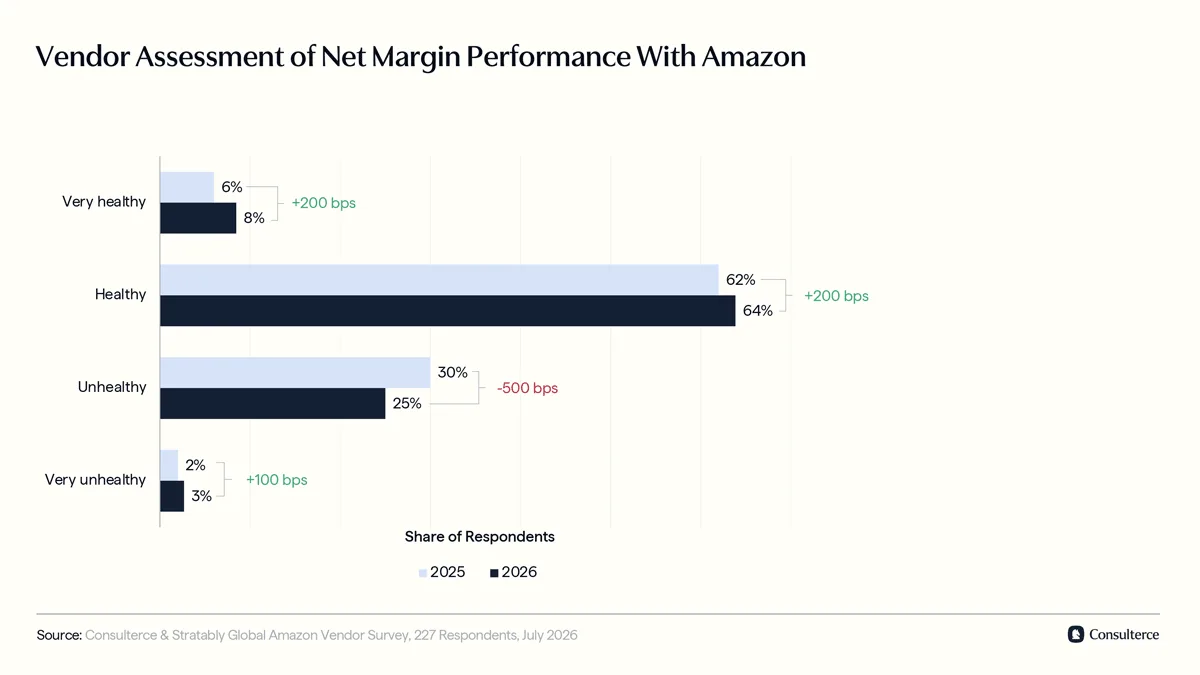
Now, this contradicts the anecdotal feedback you may hear from most brand leaders. But several tailwinds, such as the lower-than-anticipated execution of U.S. tariffs and a macroeconomic environment that proved more resilient than feared, gave vendors more room to defend margins than the mood on the ground would suggest.
Collaboration was nearly absent in AVNs
If you were hoping 2026 would mark a fresh start in your trade relationship with Amazon, you were likely disappointed.
The majority of surveyed brands (55%) reported very confrontational or at least challenging trade negotiations. Only 8% of all vendors perceived their AVN to be highly collaborative and win-win oriented.
This goes against much of what leadership teams would like to see from their #1 online customer. But it's a reality that, while hard to stomach, must be considered in every vendor's negotiation playbook.
AVNs took 3.1 months from start to finish
While negotiations with Amazon can feel like an endless endeavour, the average AVN took 3.1 months from start to finish, barely moving from the 3.2 months in 2025.
Hardlines vendors closed AVNs fastest (2.7 months), followed by Consumables brands (3.2 months). Softlines vendors negotiated trade agreements for an average of 4 months.
Interestingly, vendors that described their negotiations as collaborative closed their AVNs in only 2 months, whereas confrontational negotiations lasted an average of 4.3 months.
So yes, building genuine relationships with Amazon's Retail team still pays off in shorter negotiation cycles. But with Amazon leaning more heavily into automation and offshoring, that kind of relationship is certainly becoming harder to build.
Amazon raised trade terms by +50 bps YoY
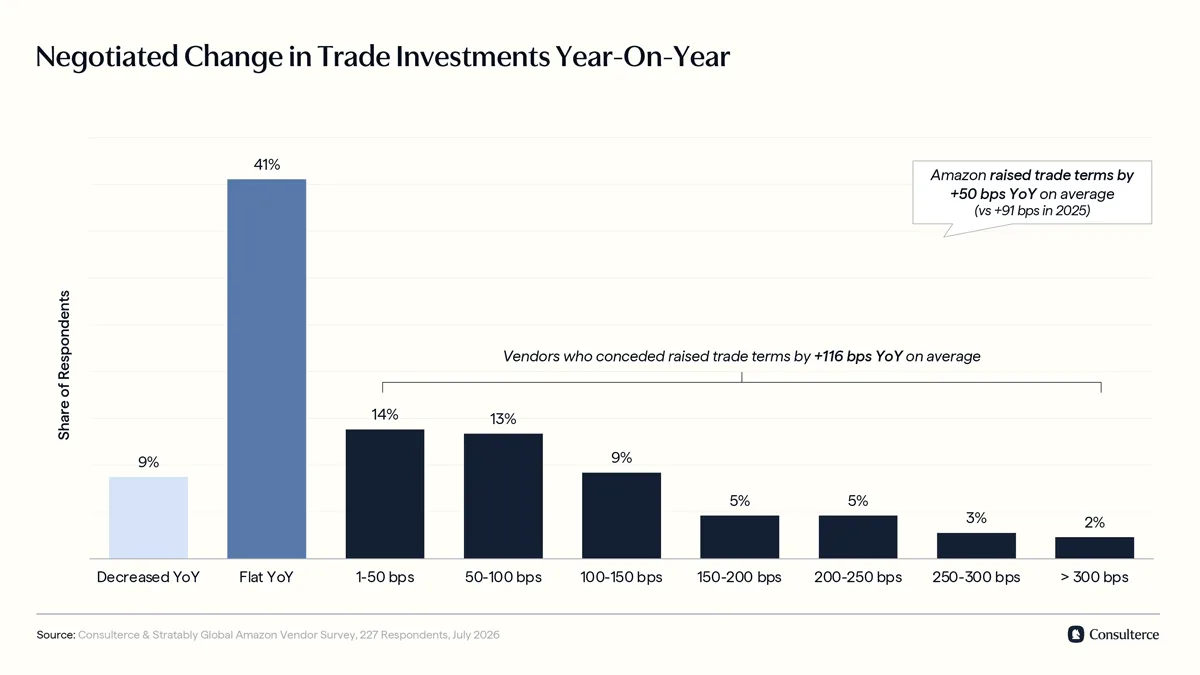
On average, vendors gave up an additional 50 basis points (bps) of trade terms in 2026 AVNs. This is 41 bps less than in 2025 and 19 bps less compared to 2024.
However, investment concessions were unevenly distributed. 1 in 2 vendors held their terms flat or decreased them year-over-year. The other 50% conceded meaningfully. The average trade terms increase among vendors who gave ground was +116 bps YoY (sic!).
Hardline vendors defended best, holding or reducing terms in 60% of cases, with the smallest average increase at +41 bps YoY. Among CPG brands, only 40% were holding the line, with an average investment increase of +53 bps YoY. Softlines vendors saw the steepest average movement at +81 bps YoY.
Vendor Managers pushed for growth, margin, and speed
Vendor Managers had three clear objectives in 2026 AVNs: Secure growth, protect margins and improve speed-to-market.
Vendor Managers were adamant about securing contractual commitments from vendors regarding deal funding and advertising budgets, which we haven't seen as a top priority in previous years. One explanation is that Amazon is now defending its ground on both sides of the Atlantic: against Walmart in the US and Joybuy's push into Europe.
Amazon also pushed for Freight Allowances to fund supply chain programs like WePay (US) and WePay+PICS (EU) in 21% of cases, feeding the same-day and 1-3 hour delivery promise that Amazon is now focusing on to gain distance from local competitors.
Last but not least, Amazon focused on protecting its bottom line by expanding base accruals and cost support budgets. It's another signal that Vendor Managers won't give up their profitability focus anytime soon.
Margin guarantees secured cost price increases
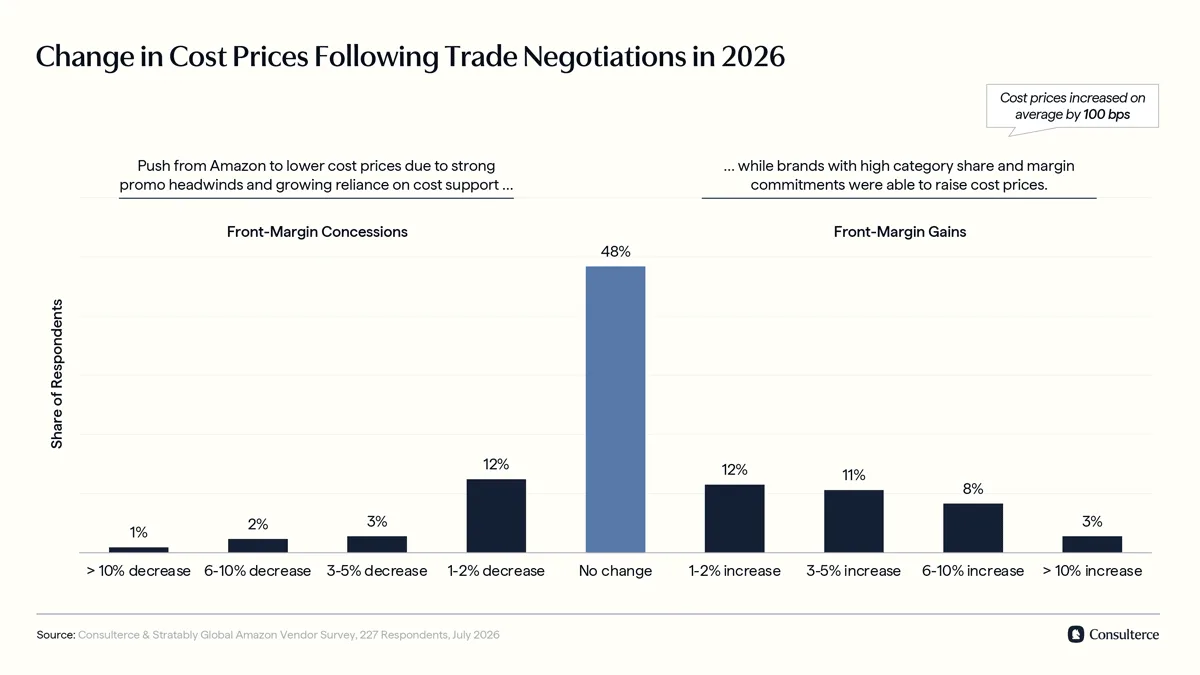
While vendors conceded on trade investments, cost prices became a positive cash flow lever for suppliers in 2026 AVNs.
48% of surveyed brands held their cost prices flat, with only 18% lowering them. A third of vendors secured a cost price increase (CPI), raising the average cost price by +100 bps YoY.
But Amazon didn't accept higher cost prices easily:
Vendors had to guarantee margins for their CPI to be accepted. Those who did secured new cost prices 57% of the time. Those who refused succeeded in just 26% of cases.
However, a higher cost price didn't guarantee a more profitable AVN outcome. In fact, those vendors that offered Amazon a margin guarantee still saw their own net margins fall 44% of the time. A secured price increase didn't protect brands from Amazon's focus on NetPPM.
Vendors scored better margin outcomes YoY
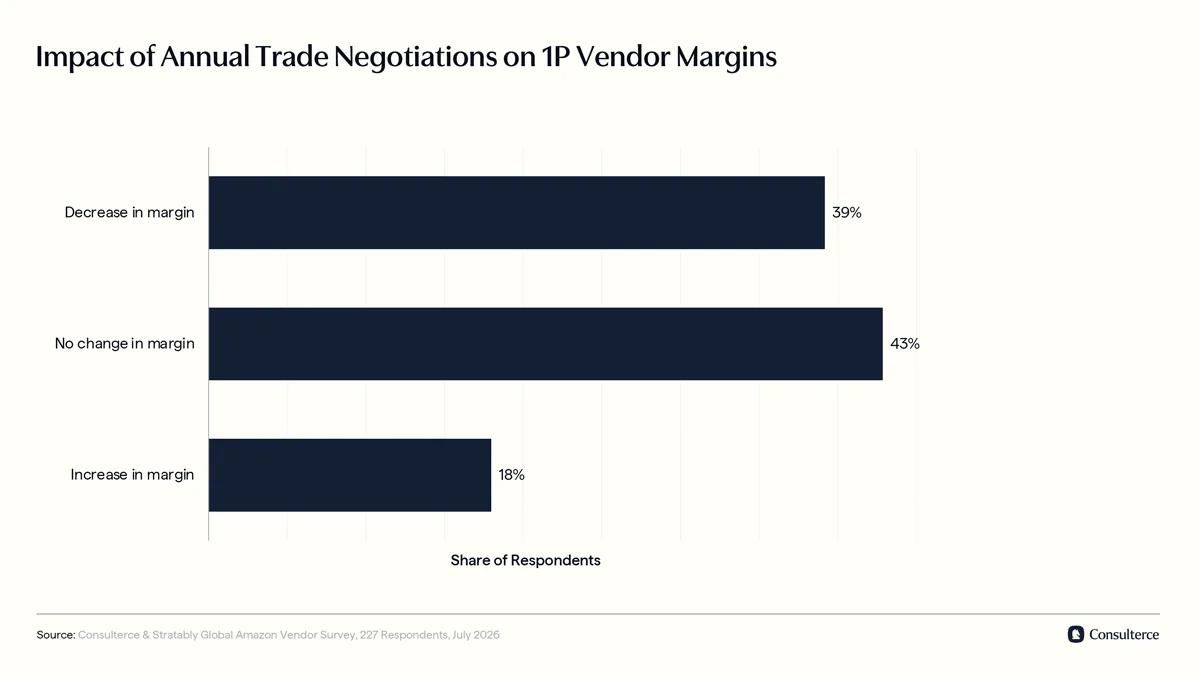
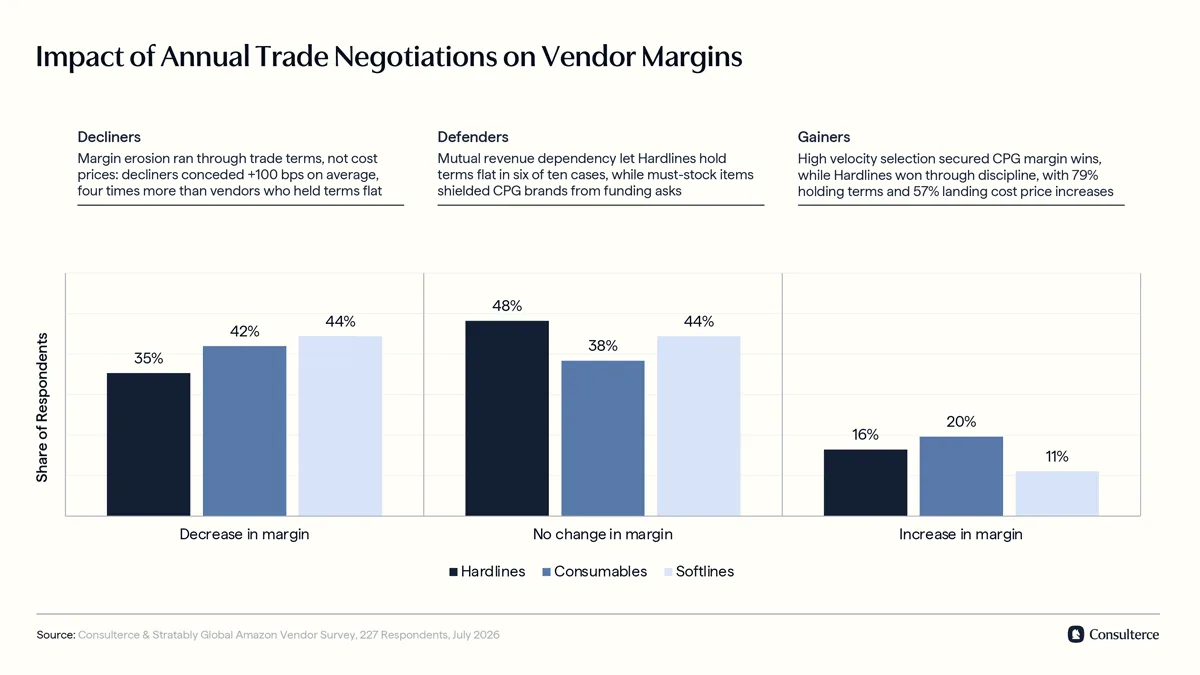
Looking at the net result of Annual Vendor Negotiations in 2026, vendor margins overall improved compared to previous years. 39% of surveyed brands reported a deterioration in margins, compared to 49% of vendors in 2025.
The majority of vendors were able to either keep their terms flat (43%) or increase their margin (18%) as a result of trade term reductions or unlocked cost savings from newly onboarded supply chain initiatives.
Interestingly, our research shows that Hardlines vendors protected their margins best: 64% either held their margins flat or improved them, while 35% saw a margin decline.
Consumables split more evenly, with 58% of surveyed vendors holding or improving margins and 42% weakening their bottom line.
Softlines came out the worst, with margins holding or improving in only 56% of cases and declining in the remaining 44%, the highest among the three families.
Amazon punished 1 in 2 vendors to force a deal
As in previous years, Vendor Managers didn't shy away from punitive actions to underline their margin asks during AVNs.
1 in 2 Hardlines and Consumables brands saw penalties applied to their accounts, while only 1 in 3 surveyed Softlines vendors faced punitive measures from Amazon.
When Amazon did apply pressure, Vendor Managers chose drastic measures over softer ones. Buy Box removals, order stop ships and deal suppressions were among the most cited measures by surveyed vendors.
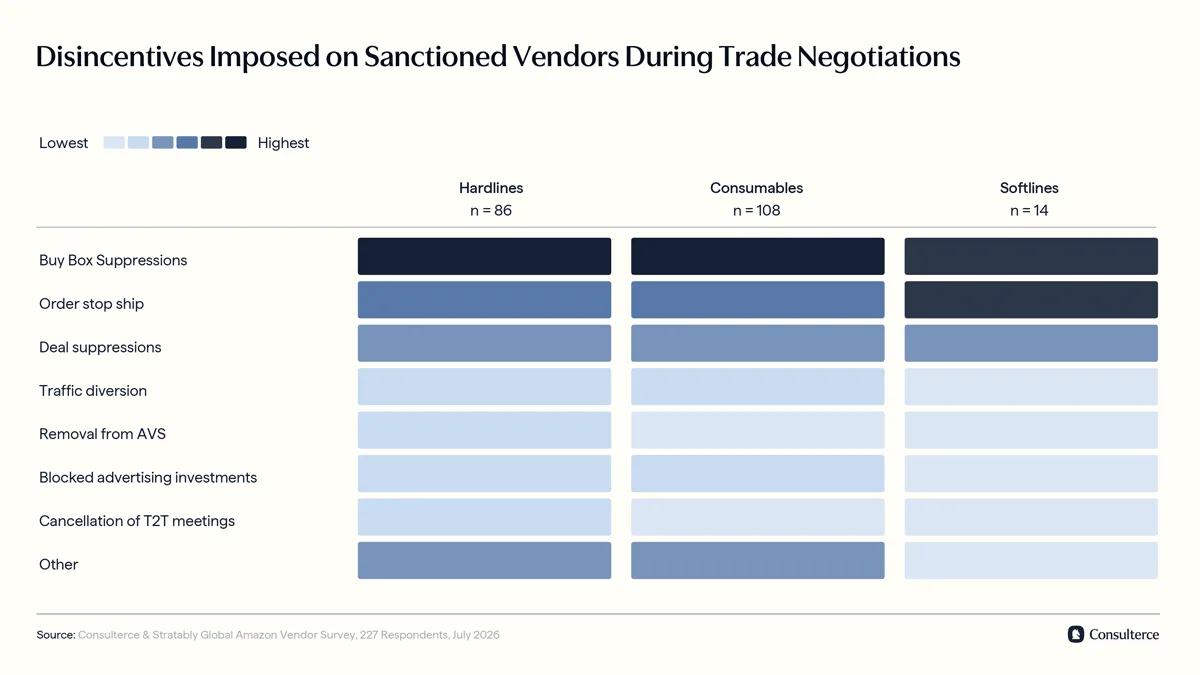
Sanctions did work in Amazon's favour: Vendors hit with two or more simultaneous measures conceded +100 bps in trade terms on average, more than double the +39 bps given up by everyone else.
What separated winners from losers in 2026 AVNs
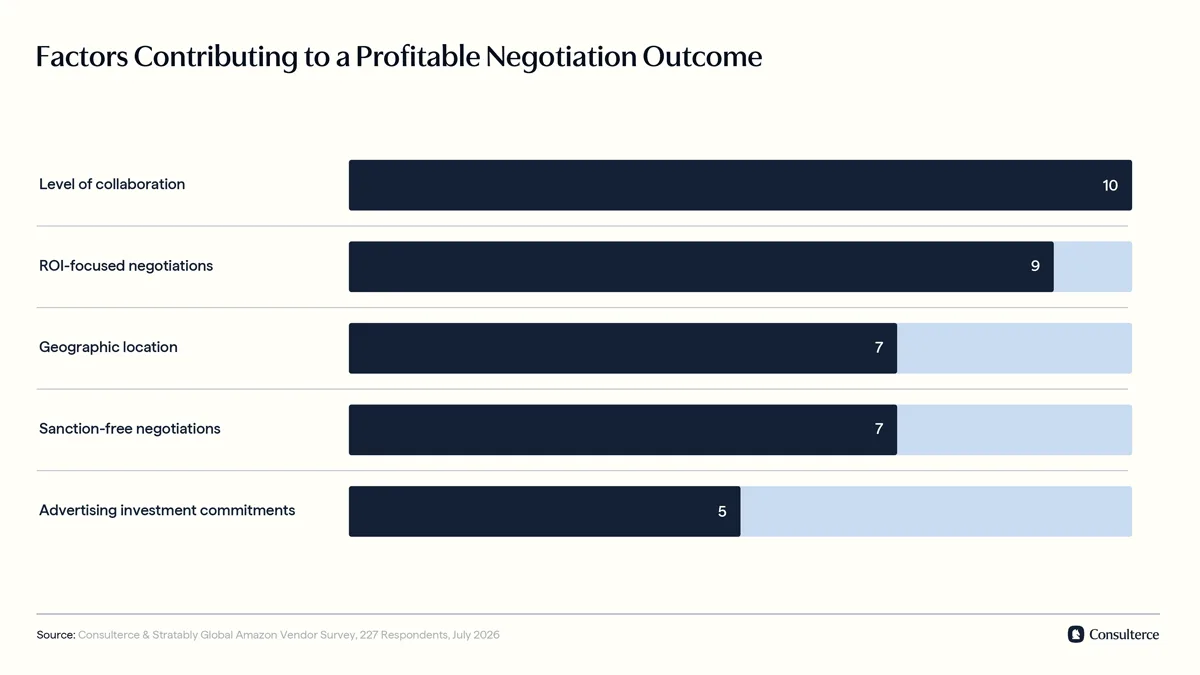
Vendors that improved margins during AVNs didn't win because of their size or category position. It largely came down to how the AVN was actually run.
Disciplined collaboration mattered most: vendors who called their AVN collaborative but also focused on improving the ROI of existing trade investments walked away with better margins far more often than those who conceded on their terms.
Geography and sanction-free negotiations played a critical part, too. North American vendors were more likely to secure a profitable AVN outcome than their European peers. This suggests that European Vendor Managers had much less room to concede on their end than in Amazon's home market.
Lastly, there was a soft correlation between vendors that offered advertising commitments as part of their AVN contracts and their overall margin outcomes. Highlighting that Retail Media investments have become more relevant within Amazon's Retail team to secure top line growth in 2026.
Conclusion
The verdict is clear: Annual Vendor Negotiations remain time-consuming and require a proactive approach to protecting your vendor margins. Giving Amazon just $1 more in trade terms today means you're ending up spending it for years to come.
Vendors that outperformed their peers in 2026 AVNs established a collaborative negotiation environment, prepared with discipline and never lost sight of an ROI-driven investment approach.
If you found value in today's article, please share it on LinkedIn or via email with your coworkers. And if you participated in the survey, Thank You! Without your support, this study would not have been possible.
Background of survey and profile of survey participants
The survey was conducted from April to July 2026 and targeted representatives of first-party Amazon suppliers. A total of 227 valid survey responses were recorded. The survey was conducted anonymously.
Vendor business size with Amazon
33% of survey respondents reported annual Amazon sales between $0 and $10 million. Another 40% of surveyed participants reported annual Amazon sales between $10 and $50 million. 11% of survey respondents reported annual Amazon sales between $50 and $100 million. 16% reported annual Amazon sales of over $100 million.
Vendor categories of survey participants
52% of survey participants sell items in the Consumer Goods (Consumables) product family, 40% actively sell Hardlines products, 8% are manufacturers in Soft Lines (Fashion, Luxury, and Accessories), and 1% are in the Media (Books, CDs/DVDs, Video Games) category.
Geographical distribution of survey participants
The survey participants were located in multiple regions. 57% of respondents were located in the UK and Europe, 42% in North America, and 1% in Latin American markets.
Disclaimer
The survey is not and was not sponsored by, run, or affiliated in any way with Amazon.com, Inc. or any of its subsidiaries.