Business Analytics
12 KPIs Amazon Vendors Need to Measure for Profitable Growth
Want to measure your success on Amazon Vendor Central? Then these 12 KPIs should be part of your business reviews.
Let's face it: Measuring success on Amazon can feel like an overwhelming task. With countless metrics to choose from, your teams need to focus on the Key Performance Indicators (KPIs) that really make the difference.
So in today's article, we shed light on the metrics every vendor should measure. No matter the size of your Amazon business.
We're going to cover:
Let's get to it.
Growth KPIs
The first set of metrics we're going to cover are growth KPIs. They help you understand your top-line performance on Amazon and the drivers behind that growth.
1. Shipped Revenue
Your Shipped Revenue represents the total sales value of products that have been shipped from Amazon warehouses to customers. It's a direct measure of your sales performance and the guiding KPI for Vendor Managers when evaluating your account.
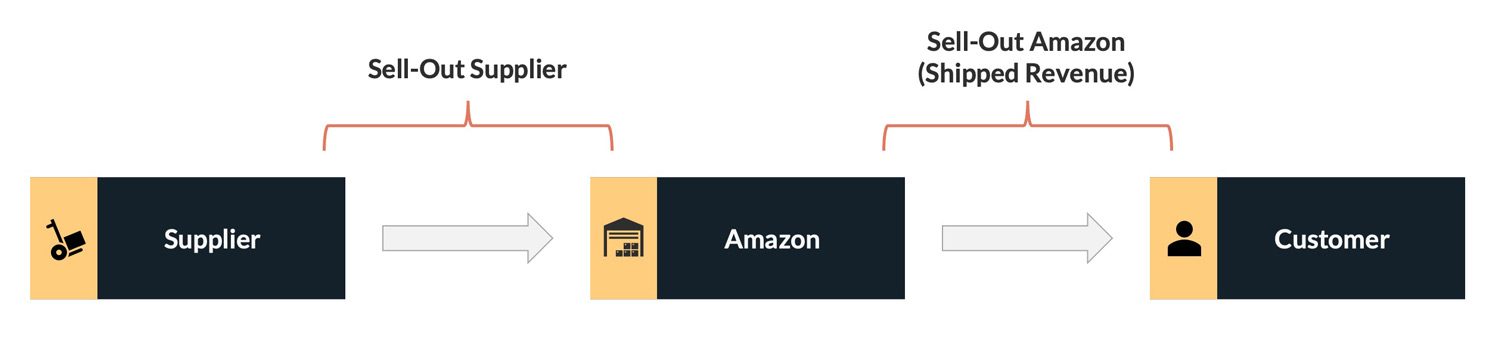
It's worth noting that many organisations only measure their sales to Amazon Retail. But this ignores the fact that Amazon is a marketplace. It simply connects existing customer demand with the supply of its vendors.
In other words, Amazon orders from you based on actual customer sales for your brand. So measuring your Shipped Revenue focuses your teams on growing sales with end shoppers, which leads Amazon to place more orders.
2. Shipped COGS
Shipped Cost of Goods Sold (COGS) relates to the total cost of all the products that have been sold and shipped.
The main difference to Shipped Revenue is that it is not based on the Average Selling Price, but your cost price to Amazon.
Shipped COGS offers insights into your direct costs in your Amazon 1P relationship. Helping you to calculate gross profit and understand the financial health of your business.
3. Average Selling Price (ASP)
The Average Selling Price (ASP) is the average price at which your products are sold. It's a critical indicator of your pricing strategy's effectiveness and the perceived value of your products in the marketplace.
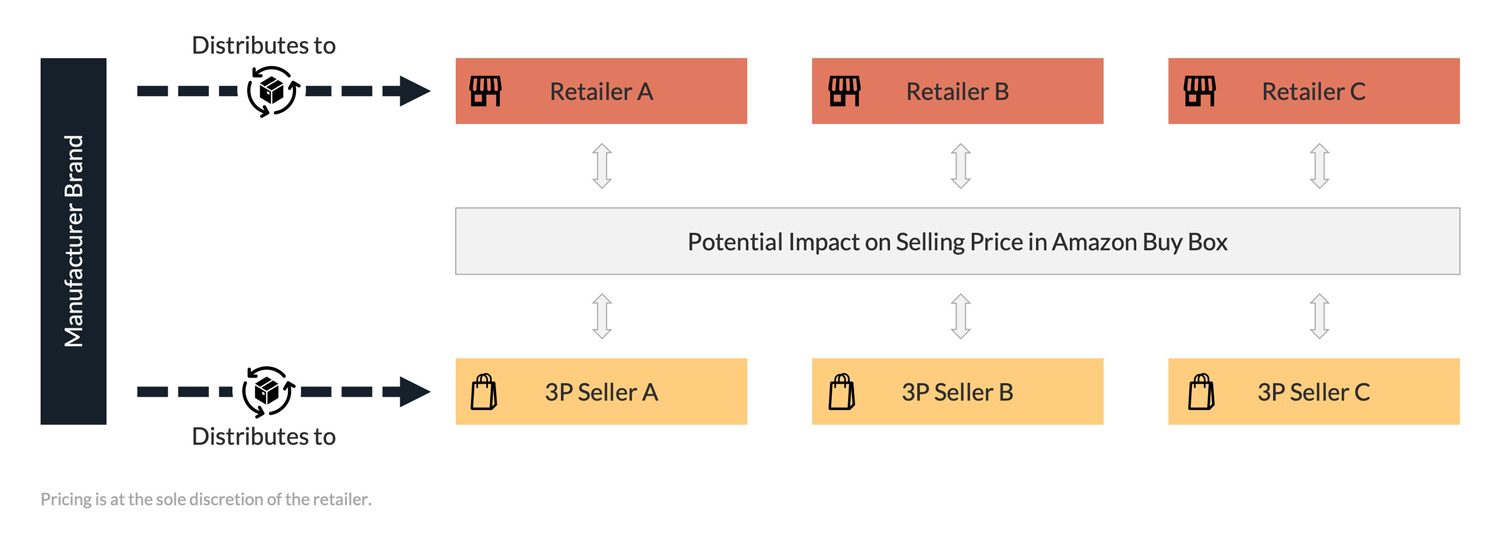
With Amazon being a price follower, any change in your ASP performance can lead to cost support requests or impact your chances of getting cost increases accepted.
Monitoring your portfolio ASP allows you to understand these headwinds and tailwinds to Amazon's margin early and inform your wider portfolio strategy.
4. Average Cost per Unit (ACU)
The Average Cost per Unit (ACU) is the average cost Amazon pays for each product sold. It is also referred to as the average cost or list price.
The ACU is a good metric to understand the less obvious reasons for your growth on Amazon.
For example, your vendor account does not only grow when you sell more of your products. Growth can also be the result of an increase in your ACU. So when cost increases with Amazon are not an option, focusing your marketing efforts on items with a higher ACU performance can be an alternative.
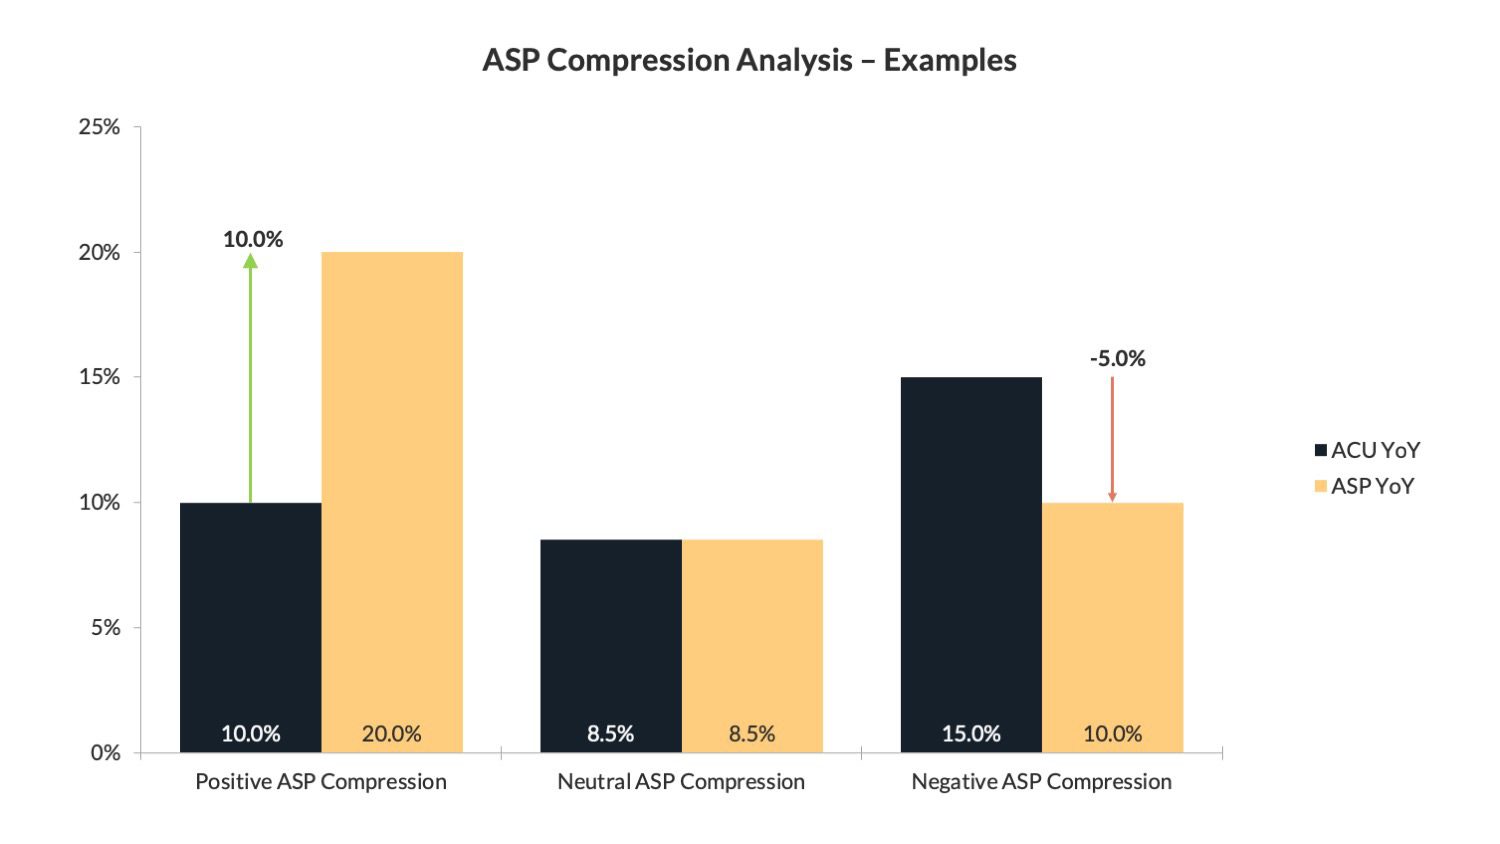
Lastly, I encourage you to monitor the dynamic between your ASP and ACU metrics. It allows you to assess whether past cost increases have proven profitable for Amazon or whether they are causing ongoing friction in your vendor relationship.
If you want to learn more about how to perform the ASP Compression Analysis, I recommend reading this article.
5. Conversion Rate
The Conversion Rate is the percentage of visitors to your Product Detail Page who have made a purchase.
It's a key indicator of how well your product listings are turning potential customers into buyers, and speaks volumes about the effectiveness of your marketing and merchandising strategies.
The Conversion Rate is also a critical factor in Amazon's search algorithm. The online retailer aims to maximise revenue per customer visit, so products with higher conversion rates are likely to rank higher in search results.
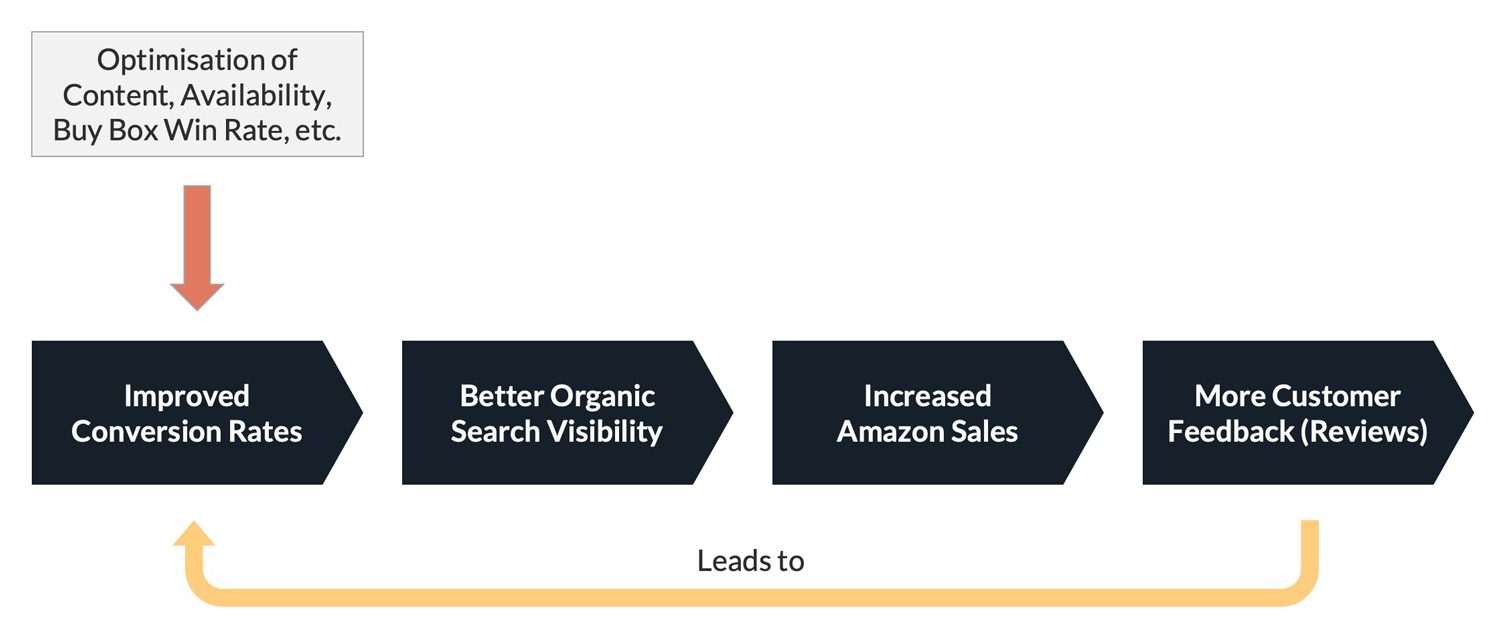
Therefore, focusing on improving your conversion rate can have a dual benefit: increasing immediate sales and boosting visibility on the platform to drive future growth.
Profitability KPIs
Now that we have looked at critical growth KPIs, let's understand how to measure your profitability with Amazon. We're going to cover the metrics to measure Amazon's profitability as well as your own bottom line.
6. Net Pure Profit Margin (Net PPM)
The Net Pure Profit Margin (Net PPM) measures Amazon's profitability of your vendor account. It's the NorthStar metric of Vendor Managers, as it includes all the cost components that brands and Amazon have insight over.
Measuring your Amazon Net PPM is vital, as any change can significantly affect your vendor account.
For example, Amazon is known to delist (CRAP) items with insufficient profit margins. On the other hand, a Net PPM increase allows your teams to take a more decisive approach to annual vendor negotiations.
Related: Amazon Net PPM: Definition and Formula Explained
7. Gross Profit
Gross Profit is the difference between your Shipped Revenue and Shipped COGS with Amazon. It provides an overview of your financial health by showing how much you earn after subtracting the direct costs associated with the sold products.
Measuring the Gross Profit of your Amazon business allows you to understand the efficiency of your production process and pricing strategy.
A high gross profit margin indicates that your company effectively manages its direct costs and pricing its products appropriately. On the other hand, a low gross profit margin can be a warning sign of inefficient production, ineffective pricing, or both.
Related: Profit Margins: Definition, Formulas and Examples
8. EBITDA
EBITDA stands for Earnings Before Interest, Taxes, Depreciation, and Amortisation. It's a widely used measure of a company's profitability and operating performance.
By focusing on earnings derived from core business operations, EBITDA gives you an unobstructed view of your operational efficiency without the influence of factors like tax environments, financing decisions, and non-cash expenses.
Operational KPIs
It's time to review the operational performance of your vendor account. So here are the key metrics your teams should measure to understand your supply chain and inventory performance and identify process defects.
9. Lost Buy Box
The Lost Buy Box metric measures how often your products were not featured in Amazon's Buy Box. Losing the Buy Box means your product isn't the default choice for customers, which can significantly impact your sales.
Monitoring this KPI helps you understand your competitiveness on the Amazon marketplace and develop strategies to regain the Buy Box when lost. As a rule of thumb, aim to keep your Lost Buy Box performance under 3% across your entire portfolio.
Related: How to Win the Amazon Buy Box: Proven Strategies
10. Sourceable Product OOS
Sourceable Product Out Of Stock tracks the percentage of times your listings were unavailable for customers to purchase on Amazon.
This measure is vital because even temporary stock-outs can have lasting effects on your sales rank, customer satisfaction, and overall performance on the marketplace.
It's recommended to keep this metric below 5% to maintain a consistent supply that meets customer demand and optimises your sales.
11. Confirmation Rates
Confirmation Rates refer to the percentage of Amazon Purchase Orders that your business confirms and fulfils. It is a direct input metric for your out-of-stock performance with the online retailer.
A high PO Confirmation Rate demonstrates reliability, efficiency, and strong operational capabilities, which can lead to more orders from Amazon and greater potential for sales growth.
By monitoring this KPI, you can identify bottlenecks and issues in your supply chain and address them proactively to keep it close to Amazon's performance benchmark of around 80-85%.
12. Financial Disputes as a % of Revenue
Last but not least, I recommend you measure the sum of your financial disputes as a percentage of your revenue with Amazon. This is because it allows you to uncover the otherwise hidden cost centres in your P&L.
When selling via Vendor Central, small operational process defects can quickly lead to large sums of chargebacks, unpaid invoices (shortages) and other erroneous deductions that reduce your earnings with the online retailer.
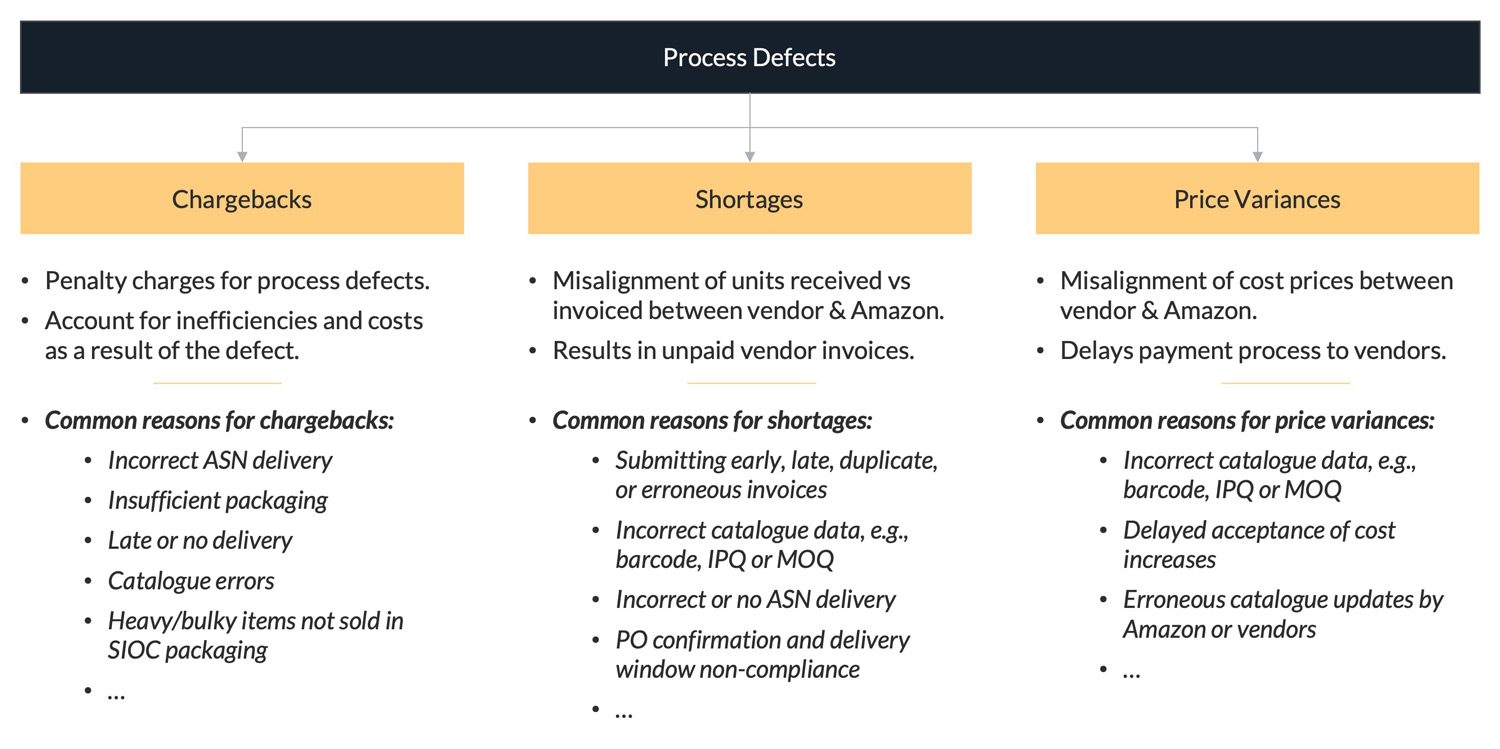
By measuring the sum of these disputes in relation to your revenue, you can define thresholds that trigger an escalation by your finance and commercial teams with Amazon.
This ensures that financial disputes are addressed on time and don't grow into even bigger problems later on.
It's good practice not to allow financial disputes to exceed 3% of the value of your sales revenue in any given period.
Final thoughts
Measuring the success of your Amazon vendor business doesn't have to be complicated. But it requires your teams to review the right set of Key Performance Indicators.
Measuring growth, profitability, and operational KPIs will get you off to a good start. And if you want to learn how to extract these data points from Vendor Central, read this article.
Need help assessing your vendor performance with Amazon?
If you need help to understand your vendor performance with Amazon, get in touch. I offer tailored vendor audits to uncover your full margin potential with the online retailer.