Vendor Negotiations
ASP Compression Analysis: Exposing the Cost Price Potential of Amazon Vendors
As a 1P vendor, you know that increasing your cost prices with Amazon can be difficult.
The online retailer's price-follower strategy adds complexity to the process of updating your cost structures. And even if your cost increase is accepted, products may get delisted due to low profitability.
What's more, even agencies and consultants often don't know how to support vendors with cost price increases (CPIs). This can make it challenging to improve your profit margins.
But what if I told you there was a way to assess your chance of raising prices with Amazon without risking products being delisted?
Introducing: The ASP Compression Analysis.
Today's article will cover:
What is ASP Compression?
To understand ASP Compression, we first need to understand its components: ASP and ACU.
-
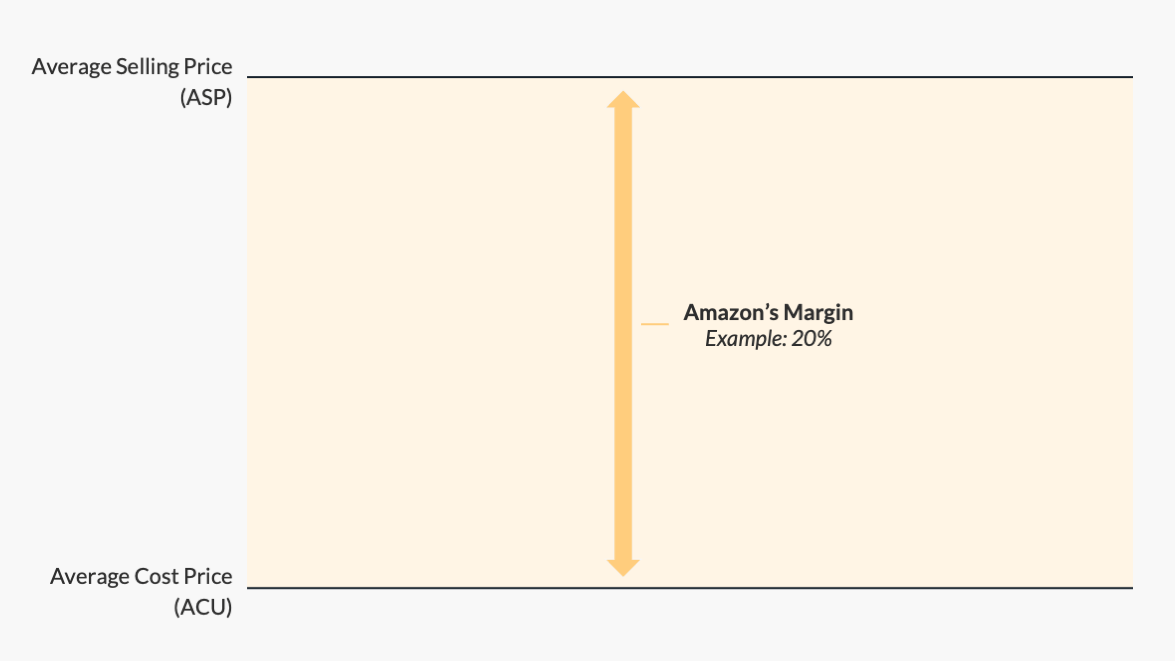
ASP is short for Average Selling Price. As the name already suggests, it is the weighted average price Amazon sells your products to shoppers, excluding any sales tax or VAT.
-
ACU stands for Average Cost per Unit. It describes the weighted average cost price at which you sell products to Amazon.
Now that we know its components, we can define the term ASP Compression:
In simple terms, ASP Compression describes the difference between the movement of the ASP and ACU. And it can be measured at ASIN or vendor account level with Amazon.
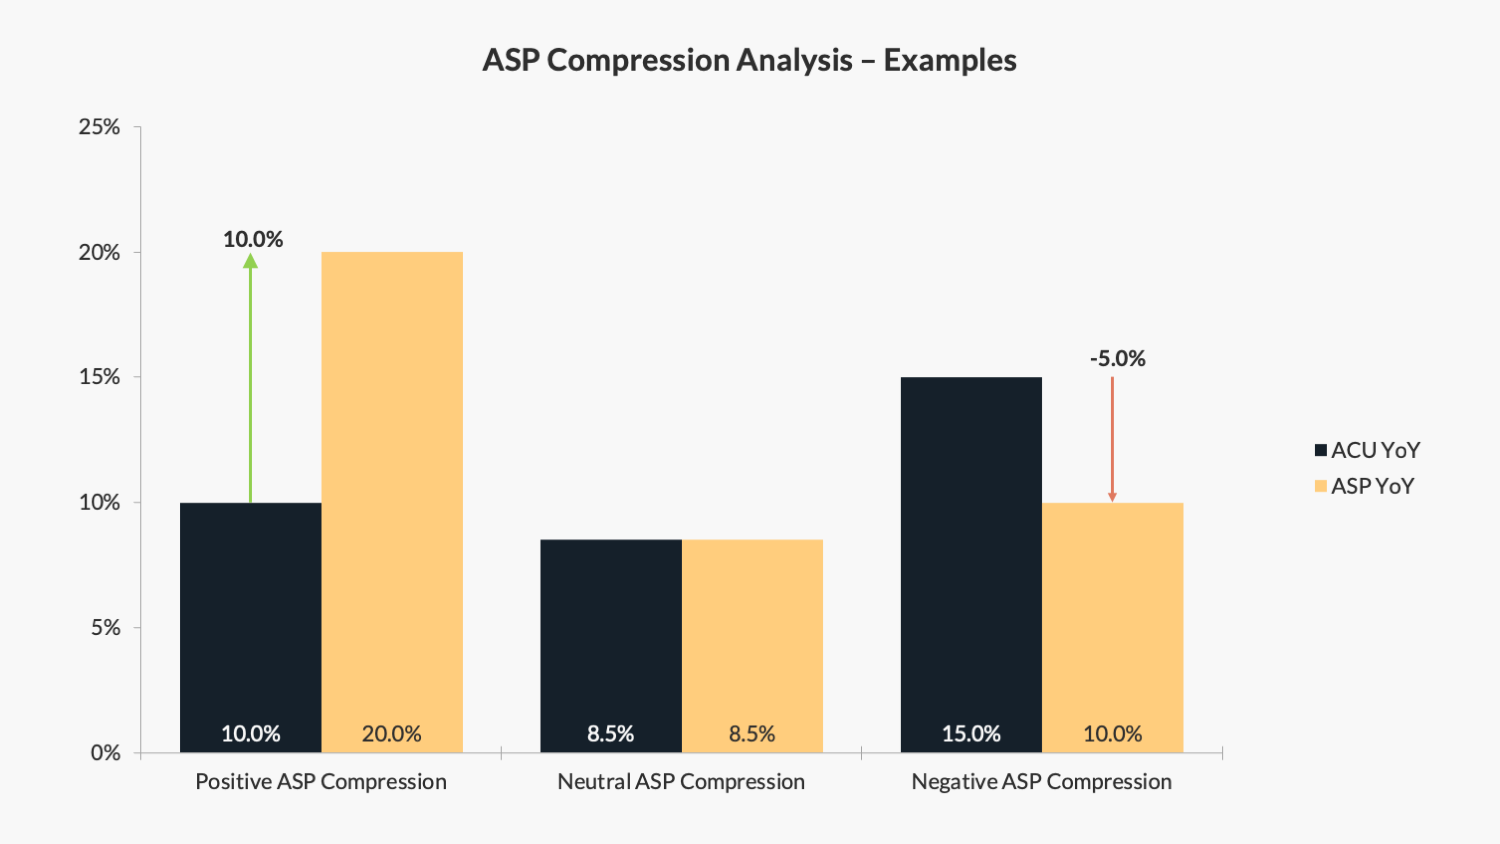
Let's take a look at the following examples:
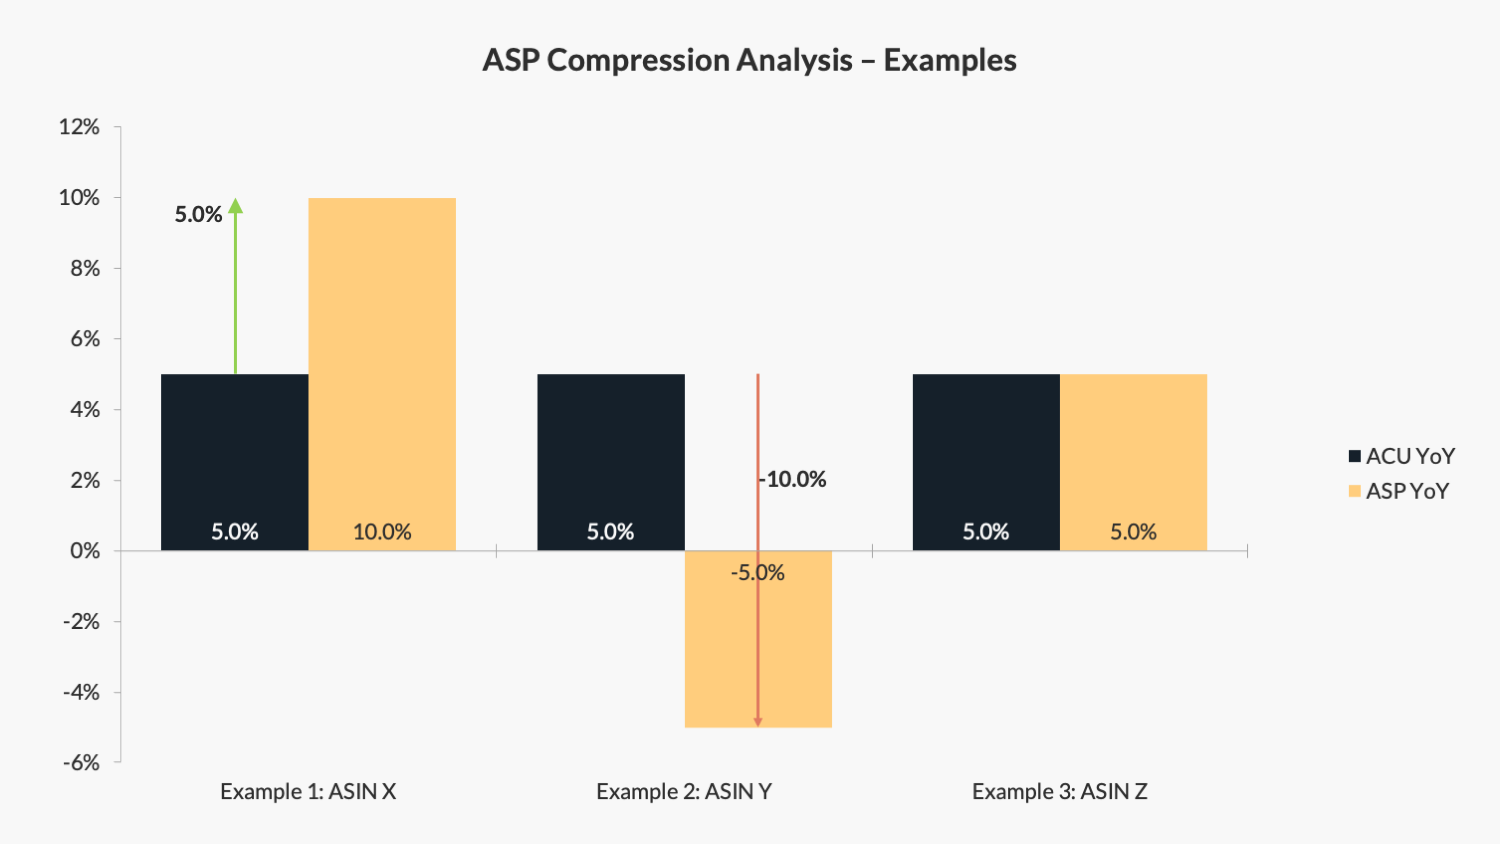
Example 1 – Positive ASP Compression
ASIN X has an ASP of +10% YoY and an ACU of +5% YoY. The resulting ASP compression is the difference between those figures: +5%.
Example 2 – Negative ASP Compression
In this example, ASIN Y has an ASP of -5% YoY and an ACU of +5% YoY. The resulting ASP compression is -10% as the selling price declined, while costs have increased.
Example 3 – Neutral ASP Compression
Now, ASIN Z has an ASP of +5% YoY and an ACU of +5% YoY. The resulting ASP compression is zero, as both the selling and cost price have equally increased.
We'll dive into the details of how to run this analysis in a minute.
But first, let's understand:
Why should Amazon vendors analyse their ASP Compression?
You might ask yourself why you should run an ASP Compression Analysis in the first place. After all, you should be able to raise your cost prices with Amazon as you please.
But that's the theory.
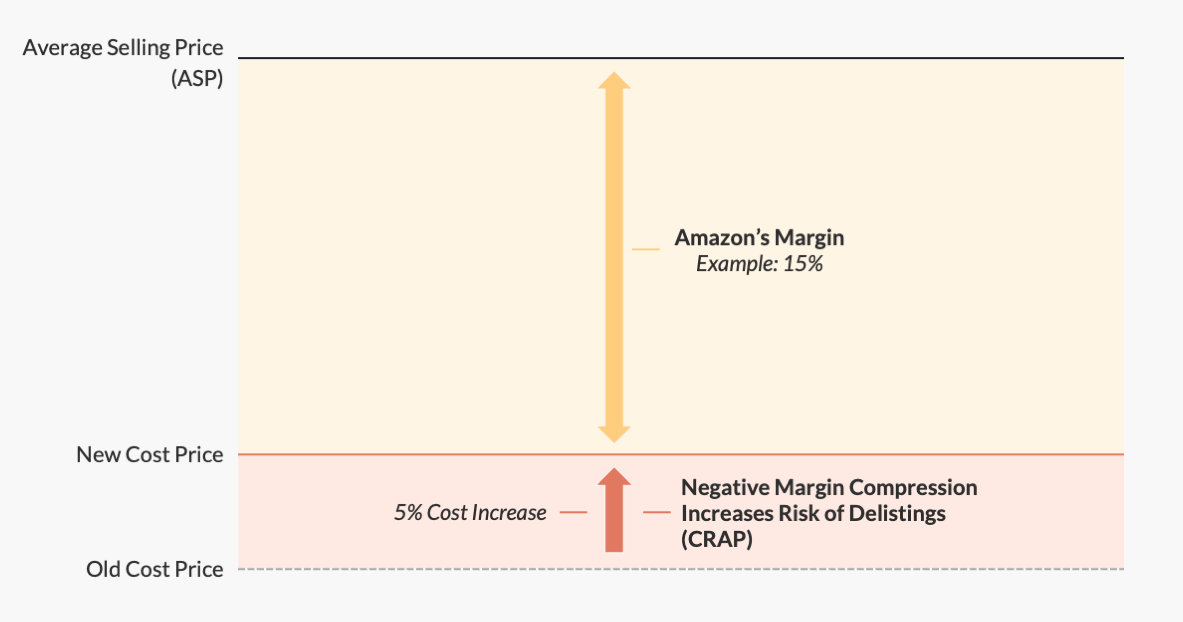
In practice, most CPIs get either rejected or lead to product delistings (CRAP) because the resulting margin is insufficient for Amazon. That's because Amazon is a price follower.
In other words: Amazon will not raise its product prices to shoppers just because you raised your cost prices. In most cases, the online retailer will still orient its prices based on offers from other 3P Sellers and retailers.
This is where the ASP Compression Analysis comes in.
It allows you to assess:
-
How much you can increase cost prices,
-
The risk of products getting delisted (CRAP'ed),
-
Whether you should raise cost prices at once or in stages.
How to analyse your ASP Compression with Amazon
Analysing your ASP Compression is relatively easy. Simply follow the three steps below:
Step 1: Log In to Vendor Central
Log in to Vendor Central and navigate to Reports » Retail Analytics » Sales.
Then select a time frame that captures at least the last three to six months. This ensures you analyse a period long enough for any ASP and ACU trends to materialise.
Lastly, click on Show Advanced Filters and tick the box next to Year over year.
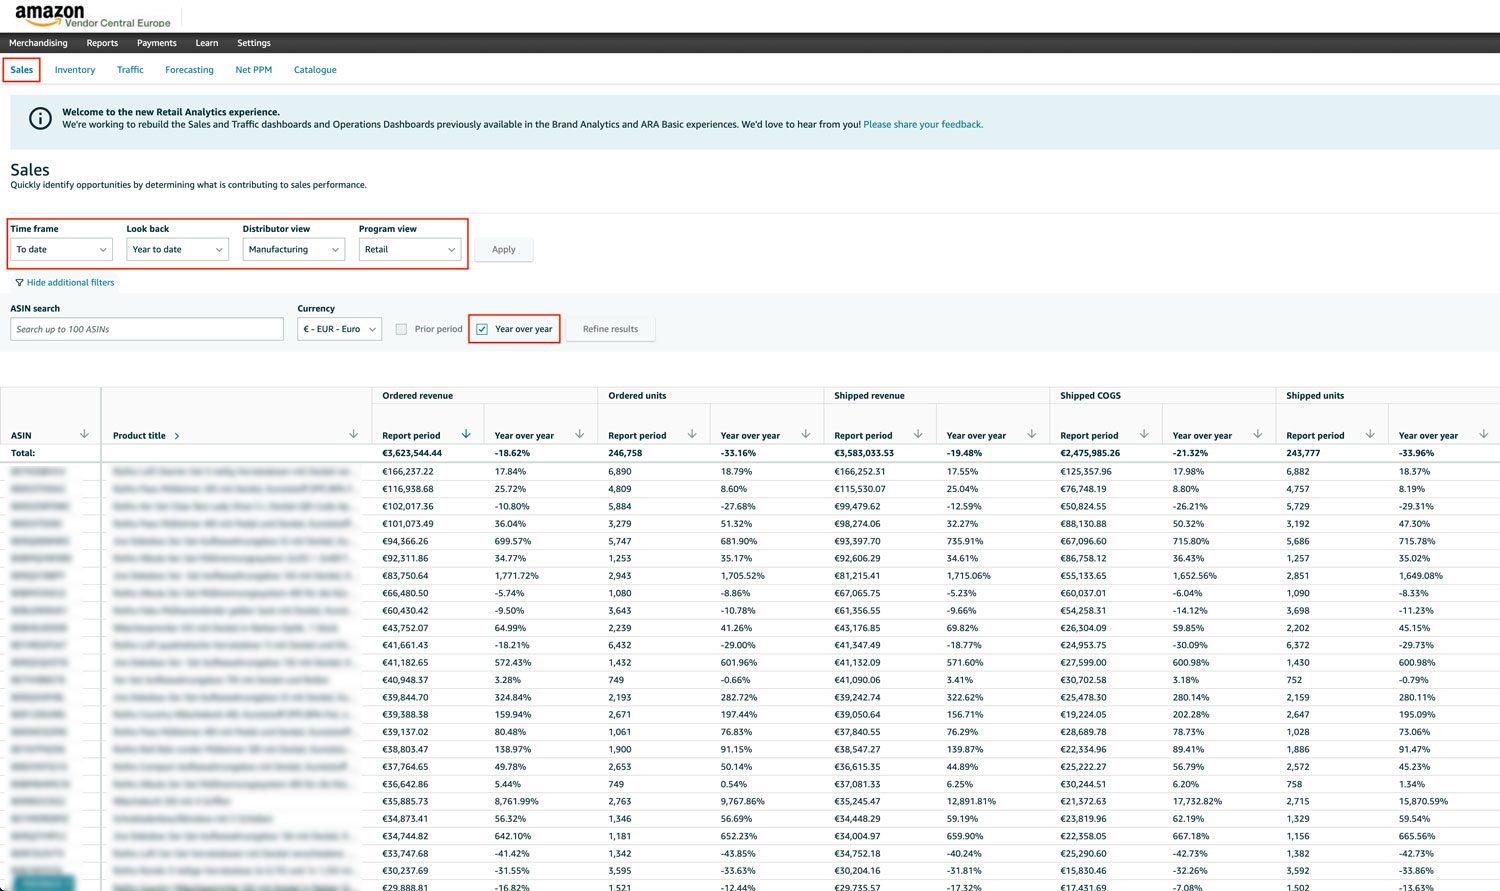
Step 2: Extract ASP and ACU from Vendor Central
Note that Amazon does not provide ASP and ACU as individual metrics in Vendor Central. However, you can extract them with the following calculation:
ASP = Shipped Revenue / Shipped Units
ACU = Shipped COGS / Shipped Units
And that's all there is to it.
Step 3: Compare the year-over-year performance
To finalise the ASP Compression Analysis, compare the ASP and ACU year-over-year and express it in per cent.
You can do this by taking both metrics and dividing their current value (T1) by the value of the same period last year (T2):
ASP YoY = ASP T1 / ASP T2 – 1
ACU YoY = ACU T1 / ACU T2 – 1
The ASP compression can then be calculated as follows:
ASP Compression = ASP YoY – ACU YoY
Analysing the results and informing your cost increase strategies with Amazon
Now that you know how to run the Price Compression Analysis, let's understand the implications of the results. You will either see a positive, neutral, or negative ASP compression.
Positive ASP Compression
A positive result means that the Average Selling Price of your portfolio has grown faster than your Cost Price base with Amazon.
This is good news if you want to raise cost prices with the online retailer. A positive price compression results in a higher front margin and Net PPM, which you can try and claw back through a CPI process.
This is because retail buyers see less risk in accepting a CPI when the ASP is already positively impacting the account. Consequently, you have a good chance of raising your cost prices to the level of the ASP compression percentage or above.
Neutral ASP Compression
A neutral price compression means that your ASP has increased in line with your ACU on Amazon. In this situation, you will have a hard time convincing the online retailer to accept your price increase.
When requesting a cost update in Vendor Central, your request will likely be denied. But all is not lost! In those cases, you can still contact your Vendor Manager or vendor support to request a manual cost update.
However, your success with this request will largely depend on your past margin performance and category position. If Amazon relies on your sales, you may get part of your cost increase approved.
Negative ASP Compression
A negative result means that your cost prices to Amazon have increased more than your ASP.
Two factors can cause this:
Either you have already increased your cost prices in the past. Or you have sold more of your less profitable assortment, causing a negative portfolio mix effect on your account.
Increasing your cost prices further will likely add too much pressure to Amazon's Net PPM. And could lead to product delistings if your higher cost price gets accepted.
In a situation like this, it's better to pause and understand the root causes of the negative ASP development year-over-year. Has your competition intensified? Is your distribution control in check?
Either way, Vendor Managers are unlikely to entertain your CPI request at this stage. You are better off focusing on the launch of exclusive assortment or supply chain improvement to stabilise your margins.
Conclusion
Analysing the ASP Compression on your vendor account can help inform your cost increase strategies with Amazon. It also allows you to assess the risk of delistings (CRAP) after an unprofitable cost increase with the online retailer.
However, don't forget that a positive price compression is no guarantee for successful price increases. After all, your Vendor Manager's risk perception and broader category performance may still cause them to reject your CPI request.
Need help assessing your CPI potential with Amazon?
If you need help in performing a price compression analysis, get in touch. I offer tailored vendor audits to help uncover your full margin potential with Amazon.