Business Analytics
Amazon Retail Analytics: The Complete Guide for Vendors in 2026
If you're looking to grow your vendor business with Amazon, having access to the right data insights is key. Thankfully, Vendor Central offers a Retail Analytics dashboard to inform your strategy with the online retailer.
So if you're wondering how to get the most out of Amazon's Retail Analytics (ARA), or just want to learn more about its specific use cases, you've come to the right place!
Today, we're taking a closer look at each report featured in Vendor Central.
After reading this guide, you'll have a better understanding of how to use Retail Analytics and where to find the metrics that matter. This will help you make better data-driven decisions to support your profitable business growth with Amazon.
This article will cover:
Understanding the Basics
First things first, let's cover some basics to reduce confusion when using Amazon's data dashboards in Vendor Central.
The difference between Retail and Brand Analytics
The Retail Analytics dashboard includes metrics about the commercial and operational performance of your vendor account. It is split into a Sales, Inventory, Traffic, Forecasting, Net PPM and Catalogue dashboard.
The Brand Analytics dashboard provides data insights into shopper behaviour on Amazon with your products and brand. It includes the Repeat Purchase Behaviour, Top Search Terms, and Market Basket Analysis dashboard.
Manufacturing versus Sourcing view
There are two distributor views available in Vendor Central: Manufacturing and Sourcing view.
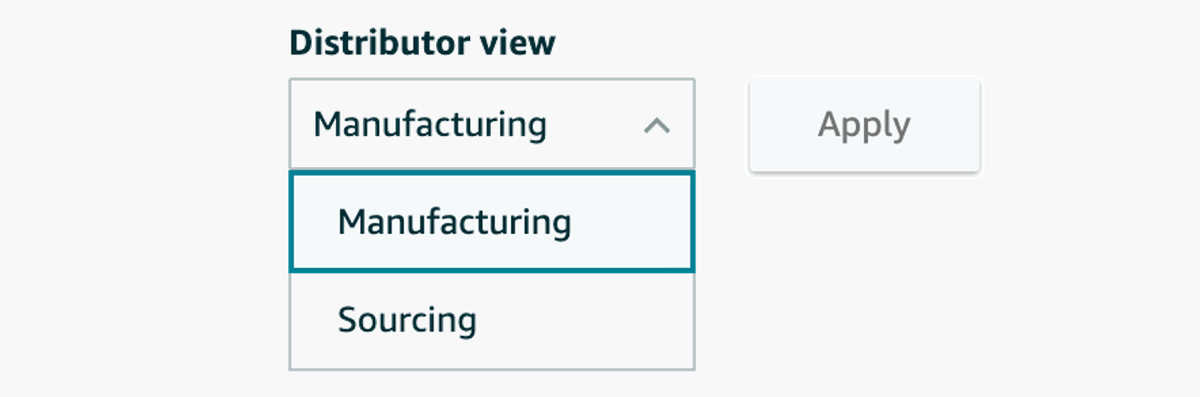
The Manufacturing View is only available for manufacturer brands on Amazon. It shows the aggregated sales and inventory performance of your brand, regardless from where or whom the products were sourced.
This means that the metrics shown are not always directly linked to the performance of your account, as they may include products sourced from distributors and wholesalers. The manufacturer view also includes (pan-European) and cross-border sourced inventory.
The Sourcing View shows metrics that relate directly to your account's performance. It reflects the actual sales and inventory that Amazon has sold and sourced from your inventory only.
Comparing your data: Prior Period versus Year over Year
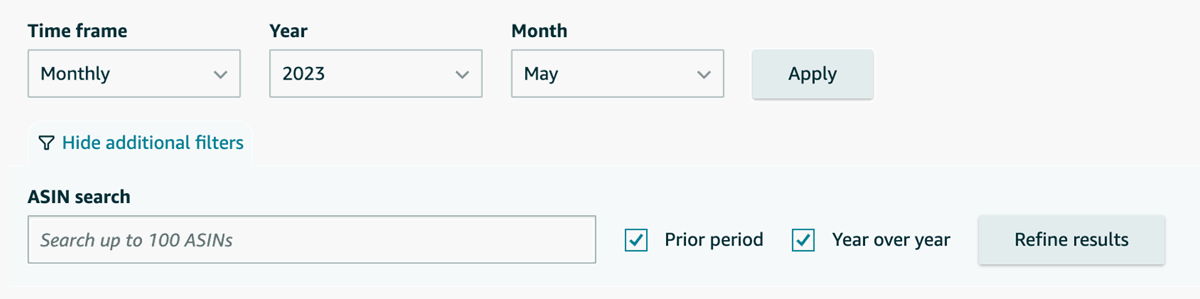
When using Retail Analytics, you often have the option to compare your data set with either the prior period or year over year.
By selecting "prior period", Amazon compares your data with the same period before the one currently selected. For example, if you are viewing data from January, the previous period refers to December.
However, if you select "year over year", Amazon will compare your data set with the same period last year. So if you are viewing data from January this year, Amazon will compare your data to January last year.
And with all that out of the way, let's take a closer look at each Retail Analytics dashboard in Vendor Central.
ASIN, Brand, Category, and Geographical Data Filters
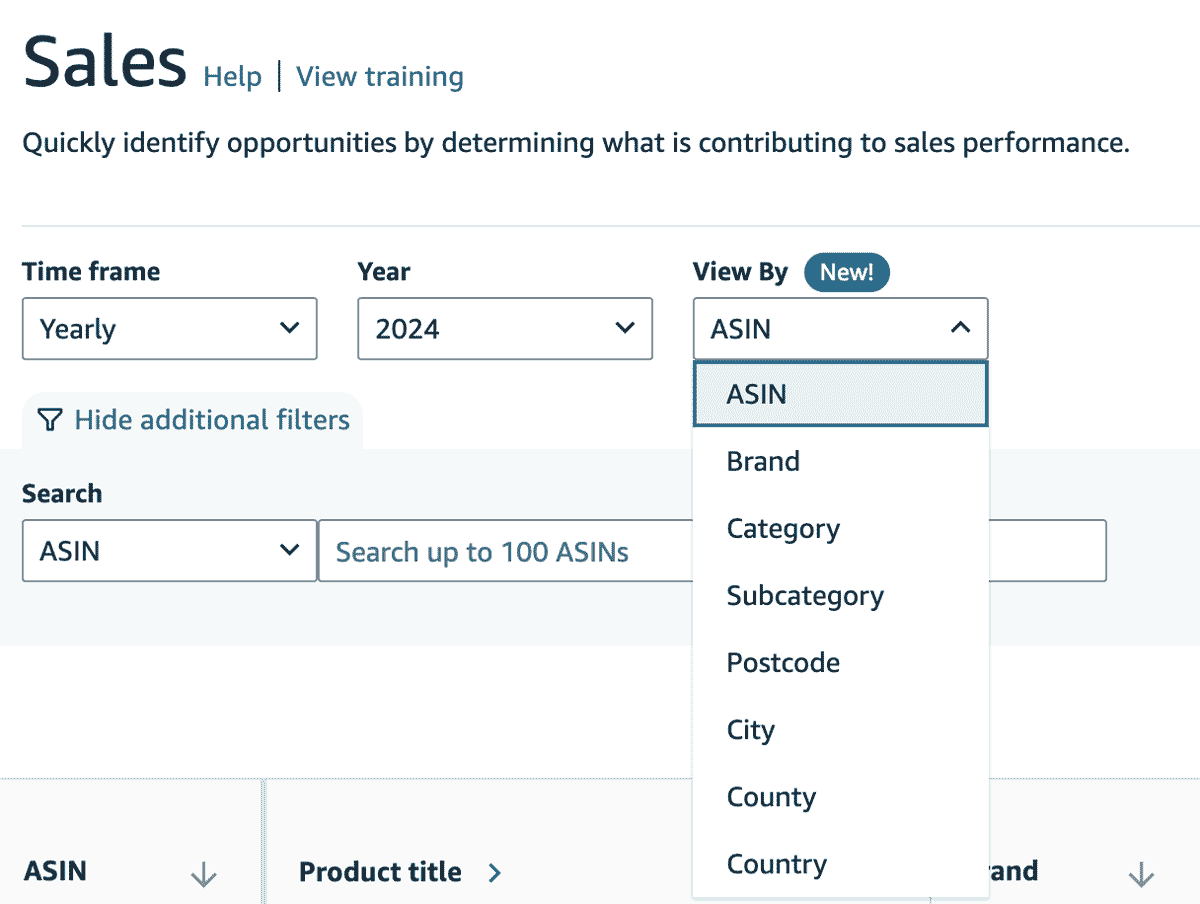
If you manage multiple vendor accounts across different markets, Amazon lets you segment your data with filters. This feature is useful whenever you're trying to get a holistic overview of your inventory or sales performance across regions and vendor codes.
Amazon currently offers the following data filters:
- ASIN
- Brand
- Category
- Subcategory
- Postcode
- City
- County
- Country
Retail Analytics Sales Report
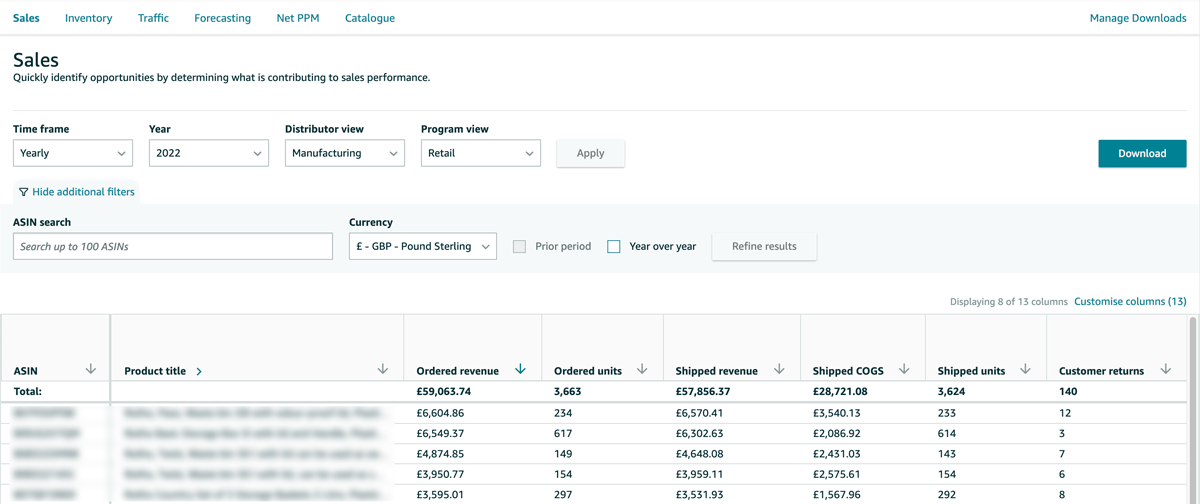
The sales dashboard lets you quickly identify which products contribute to your overall sales performance. It lists every product sold in the selected time frame and shows the dollar value, ordered and shipped units, as well as any customer returns.
Critical KPIs to review:
- Ordered Revenue
- Shipped Revenue
- Dispatched or Shipped COGS
- Customer Returns
| Metric | Definition |
|---|---|
| Ordered Revenue | The ordered revenue that has not yet shipped to Amazon customers. Revenue = Average Seling Price * Sales Volume. |
| Ordered Units | The number of ordered units that have not yet shipped to Amazon customers. |
| Shipped Revenue | The shipped revenue from Amazon to customers. |
| Shipped units | The number of shipped units from Amazon to customers. |
| Dispatched or Shipped COGS | The shipped COGS from Amazon to customers. COGS = Cost Price * Shipped Units. |
| Customer Returns | The number of items returned by customers. |
Retail Analytics Real-Time Sales Report
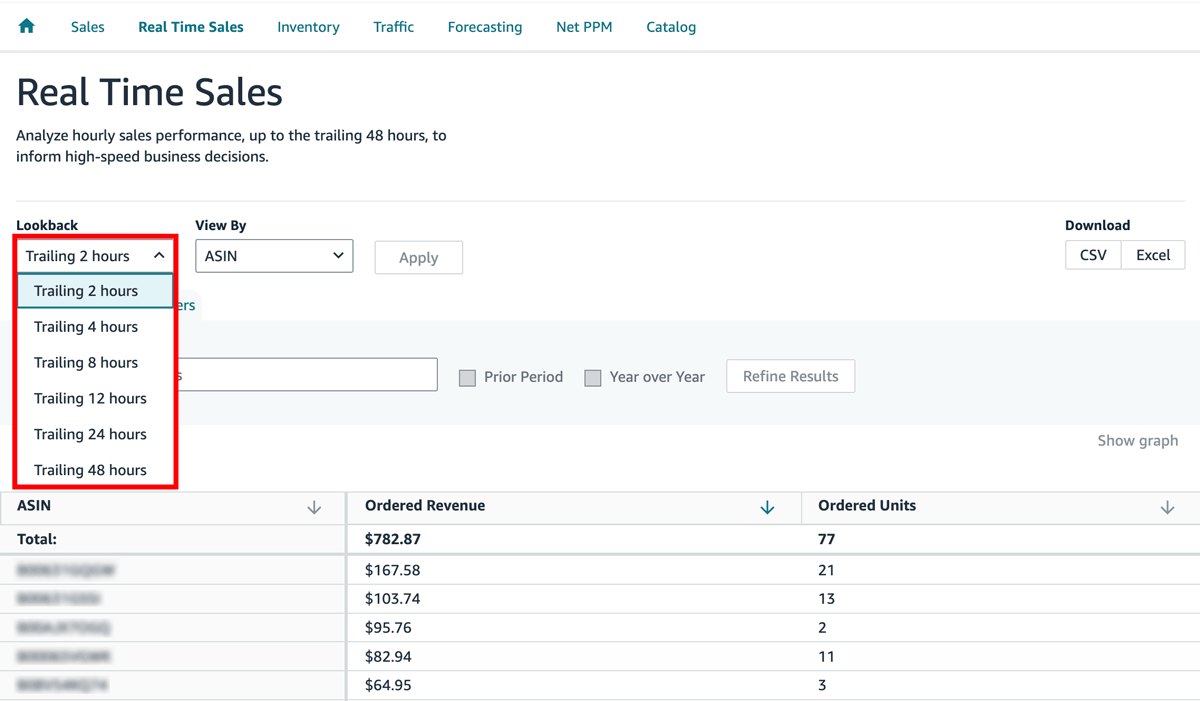
For vendors that run regular price promotions and need insights into the live sales performance of their catalogue, Amazon has launched the Real-Time Sales dashboard.
It allows you to see the sales of your products in real-time. This is handy if you run promotions on days with high sales volumes, such as Prime Day or Black Friday and Cyber Monday.
Critical KPIs to review:
- Ordered Revenue
- Ordered Units
| Metric | Definition |
|---|---|
| Ordered Revenue | The ordered revenue that has not yet shipped to Amazon customers. Revenue = Average Seling Price * Sales Volume. |
| Ordered Units | The number of ordered units that have not yet shipped to Amazon customers. |
Retail Analytics Inventory Report
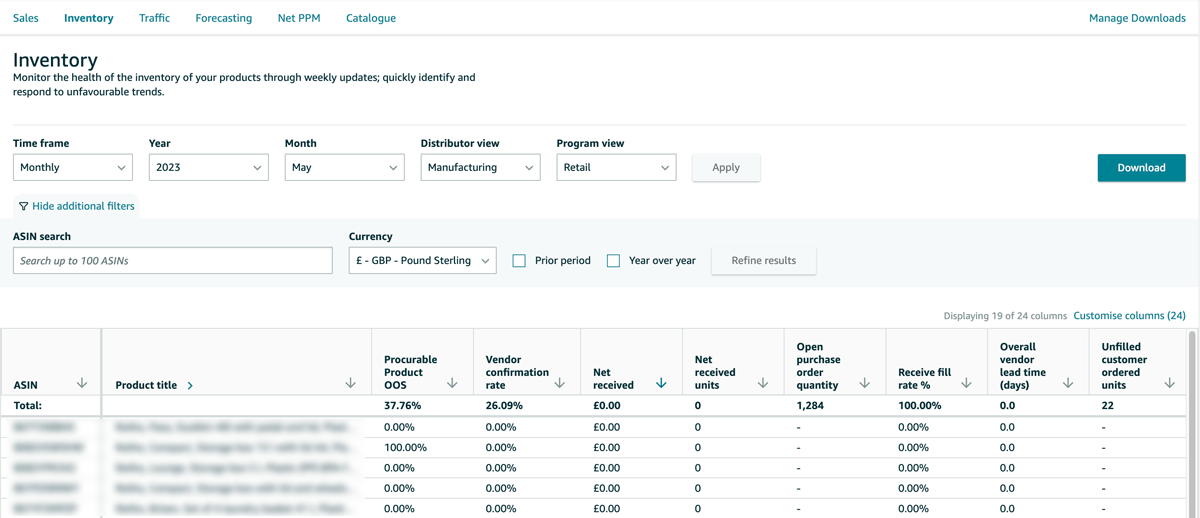
The inventory report includes vital information to measure the operational health of your account. It tells you which products are out of stock and which have accumulated unhealthy overstock.
The dashboard also shows your order confirmation rate and how much Amazon sourced from your brand in the selected period (net received). Monitoring your operational performance regularly is critical to inform your inventory allocation to Amazon.
Critical KPIs to review:
- Sourceable Product OOS
- Vendor Confirmation Rate
- Net Received Units
- Open Purchase Order Quantity
- Sellable On-Hand Inventory
- Sell-Through Rate
- Unhealthy Inventory
Note that some metrics are only available if you select a period other than daily.
| Metric | Definition |
|---|---|
| Sourceable Product OOS | Sourceable Product OOS (SoROOS). Describes the out-of-stock (OOS) rate for all products that are procurable by Amazon. Sourceable Product OOS = OOS Featured Offer Page Views on Sourceable ASINS ÷ Total GVs. |
| Vendor Confirmation Rate | Describes the confirmation rate of placed Purchasing Orders in %. Confirmation Rate = Accepted Quantity ÷ Quantity submitted by Amazon. |
| Net Received | Describes the net amount received by Amazon after deducting the amount of returned products to the vendor. |
| Net Received Units | Describes the net units received by Amazon after deducting the number of returned units to the vendor. |
| Open Purchase Order Quantity | Measures the number of items in Purchasing Orders still pending to be shipped and received in Amazon warehouses. |
| Receive Fill Rate | Expresses the amount of received units of a Purchase Order in comparison to the confirmed quantity in per cent. Fill Rate = Received Quantity ÷ Confirmed Quantity. |
| Overall Vendor Lead Time | Describes the time it takes a vendor from confirming a PO to its delivery in an Amazon warehouse, measured in days. |
| Sellable on Hand Inventory | Describes the amount or number of units that are sellable to end shoppers on Amazon. |
| Unsellable on Hand Inventory | Refers to the amount or number of units that are not sellable to end shoppers on Amazon. |
| Sell Through Rate | Defines the number of units shipped versus the number of units on hand plus any received units in the same time period. Sell Through Rate = (Shipped Units – Customer Returns) ÷ (On Hand Units + Received Units). |
| Unhealthy Inventory | Describes the amount or number of units that are deemed as overstock by Amazon. |
Retail Analytics Traffic Report
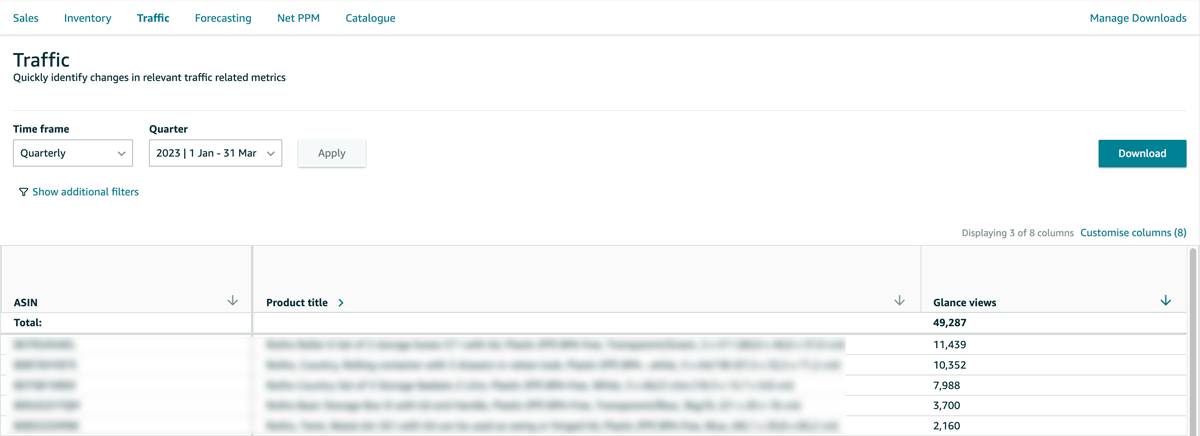
Amazon's traffic report is the most limited data dashboard in Retail Analytics. It only contains information about the number of your listing's detail page impressions when Amazon won the Buy Box.
However, together with the Ordered Units metric from the Sales report, you can use Amazon's Featured Offer Page Views to calculate the conversion rate of your products (Conversion Rate = Ordered Units ÷ Featured Offer Page Views).
Critical KPIs to review:
- Featured Offer Page Views
| Metric | Definition |
|---|---|
| Featured Offer Page Views | The number of times shoppers viewed your Product Detail Page (PDP) on Amazon. |
Retail Analytics Forecasting Report
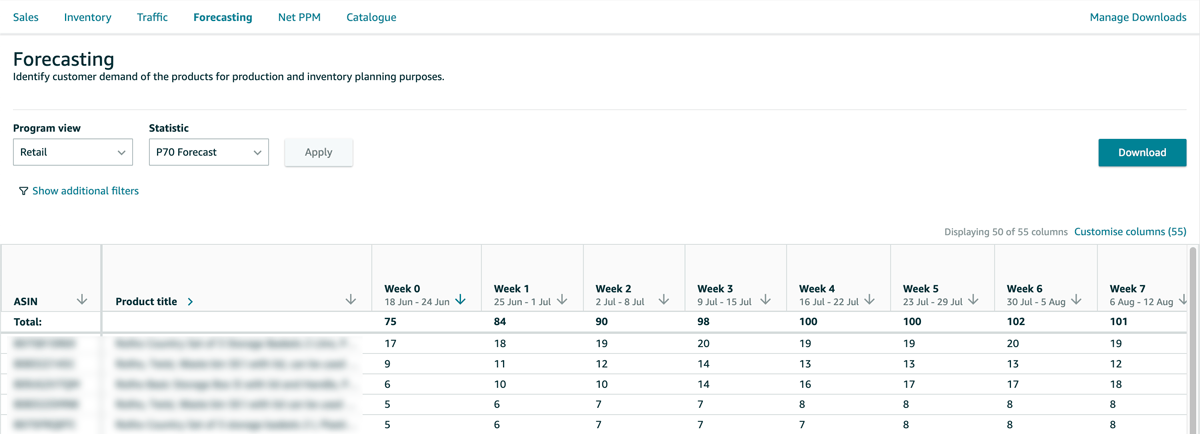
One of the most important data dashboards is the forecasting tool in Retail Analytics. It gives you access to Amazon's Mean, P70, P80 and P90 forecast.
Note that the forecast is demand and not buying-oriented. This means that Amazon's actual order volume to you as the vendor may differ from its forecast in Vendor Central.
Critical KPIs to review:
- Mean Forecast
- P70 Forecast
- P80 Forecast
- P90 Forecast
| Metric | Definition |
|---|---|
| Mean Forecast | Amazon's best estimate of weekly customer demand for the next 1-48 weeks in the future. This estimate does not account for safety stock. |
| P70 Forecast | The forecast where Amazon estimates with a 70% probability that future weekly customer demand will be at or below this value. |
| P80 Forecast | The forecast where Amazon estimates with a 80% probability that future weekly customer demand will be at or below this value. |
| P90 Forecast | The forecast where Amazon estimates with a 90% probability that future weekly customer demand will be at or below this value. |
Want a more granular definition of the listed KPIs? Have a look at my detailed Amazon glossary.
Retail Analytics Net PPM Report
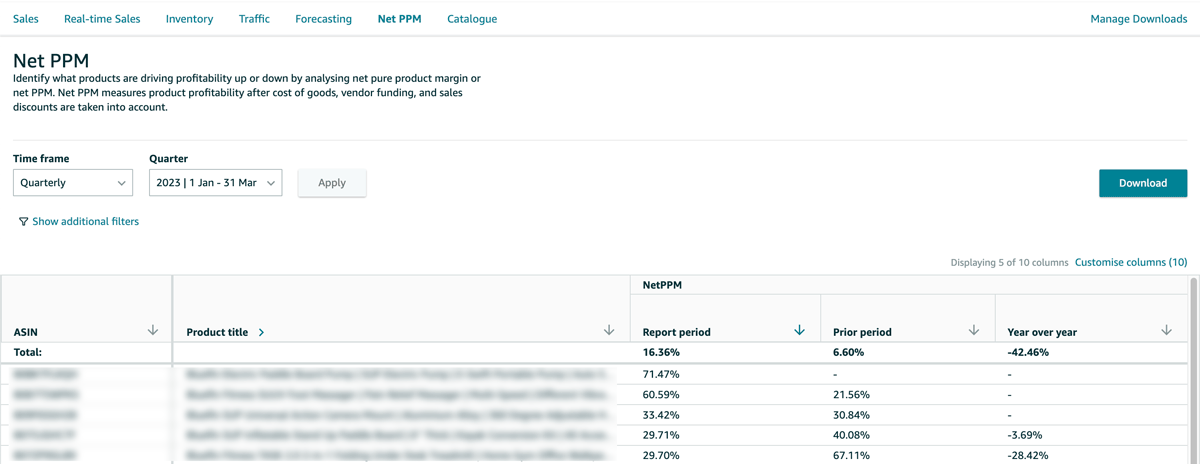
Amazon's Net PPM forms the NorthStar metric of every Vendor Manager. So it's critical you keep an eye on the margin performance of your portfolio. Thankfully, the Net PPM report in Vendor Central allows you to do exactly that.
Note that Net PPM measures product profitability after cost of goods, vendor funding, and sales discounts are taken into account. This is a fundamental change in the new Retail Analytics dashboard, as sales discounts were previously not included in Vendor Central's Net PPM.
Critical KPIs to review:
- Net PPM
| Metric | Definition |
|---|---|
| Net PPM | Short for Net Pure Product Margin. It's the primary margin Amazon communications to vendors. Net PPM = (Shipped Revenue – Shipped COGS + CCOGS – Sales Discount) ÷ Shipped Revenue. |
Want to better understand the components of Amazon's Net PPM? Take a look at my Net PPM calculator.
Retail Analytics Catalogue Report
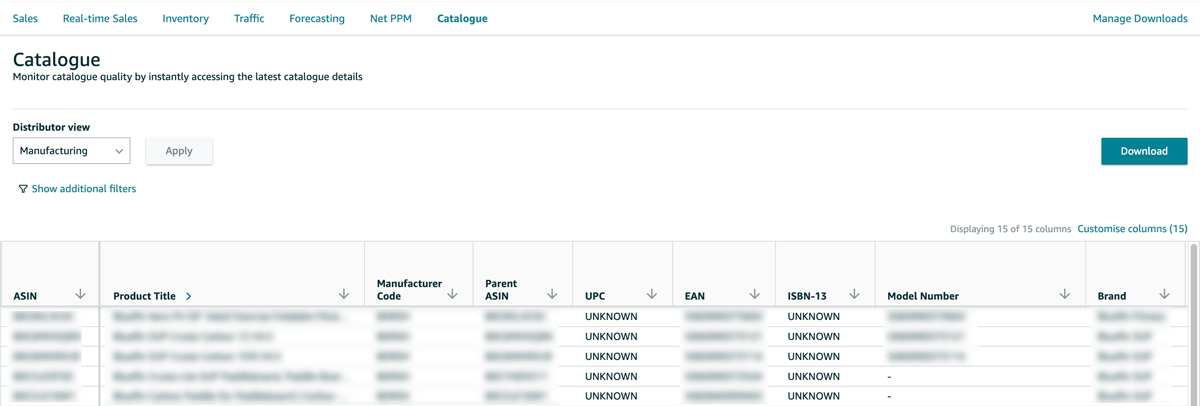
The catalogue report section in Vendor Central lets you analyse and monitor the quality of your catalogue on Amazon.
This is particularly helpful if you want to ensure that products are replenishable or if you want to understand whether a product requires any additional prep that may lead to penalty charges (chargebacks) on the account.
Critical KPIs to review:
- Product Group
- Replenishment Category
- Prep Instructions Required
- Prep Instructions Vendor State
| Metric | Definition |
|---|---|
| Product Group | The product group in which an ASIN is listed with Amazon. |
| Replenishment Category | Indicates whether a product will be reordered by Amazon again. |
| Prep Instructions Required | Refers to current prep instructions of an item at Amazon. For example: ASIN stickering, bagging, boxing, bubble wrap, etc. |
| Prep Instructions Vendor State | Describes who issued or certified the prep instruction for an item. |
Bonus: Frequently Asked Questions
Still having questions about Vendor Central's Retail Analytics? I have answered the most frequently asked questions below.
What happened to ARA Premium?
With the launch of the new Retail Analytics dashboard in 2022, ARA Premium has been deprecated. Access to the new Retail Analytics is free of charge for all vendors.
Why doesn't Retail Analytics show metrics like ASP or Conversion Rates?
Some metrics are derived, so they can be calculated using other metrics already provided. For example:
Average Selling Price (ASP) = Shipped Revenue / Shipped Units
Average Cost Price (ACU) = Shipped COGS / Shipped Units
Pure Product Margin (PPM) = (ASP – ACU) / ASP
Conversion Rate = Ordered Units / Featured Offer Page Views
Sell Through Rate (STR) = (Shipped Units – Customer Returns) ÷ (On Hand Units + Received Units).
Are sales from Warehouse Deals included in Retail Analytics metrics?
No, warehouse deals are not included in Vendor Central dashboards. This is because the proceeds from these sales don't go to you as the vendor but to Amazon instead.
I can't see some of the mentioned data dashboards – what should I do?
If you do not see the Reports menu in the Vendor Central navigation, ask your brand's administrator to review your account rights. If that does not work, you can also raise a case in Vendor Central to request a review.
Why can't I see the Sourceable Product OOS metric?
The metric is available in Retail Analytics under Inventory. However, it only shows if you select a time frame longer than a week.
Why can't I find the Lost Buy Box metric?
The Lost Buy Box metric was deprecated by Amazon. A new metric is currently under development, but it is unclear when it will be launched. If you have access to AVS, you can ask your Brand Specialist to send you a manual Lost Buy Box report.
Why don't I have access to the Manufacturing View in Vendor Central?
To access the manufacturing view in Retail Analytics, you must be the registered manufacturer brand in Amazon's Brand Registry. If you can't access the view in Vendor Central, make sure you set up your Brand Registry account and are registered as the manufacturer of your brand.
Some of my ASINs are missing in Retail Analytics. What can I do?
There are a few reasons why an ASIN might not show up in Vendor Central's Retail Analytics:
1- Ensure you have selected the correct Distributor view: Manufacturing view shows data for ASINs you manufacture regardless of who sourced them, while the Sourcing view only shows ASINs sourced directly from your vendor codes.
2- No data in the selected time period: An ASIN must have data for at least one metric in the dashboard for the selected time period to appear. For example, an ASIN with inventory will show in the Inventory dashboard but not Sales if there were no sales in that period
3- ASIN mapping issues: Vendor hierarchy and ASIN catalogue attribute setup impact how ASINs map to Retail Analytics reports. Improper mapping can cause ASINs to appear missing.
Need help assessing your vendor performance with Amazon?
If you need help to understand your vendor performance with Amazon, get in touch. I offer tailored vendor audits to uncover your full margin potential with the online retailer.