The Product Life Cycle (PLC) has become a leading concept to successfully establish products and services on the market.
The PLC consists of different phases that allow managers to visualise the projected sales and profit development of their product portfolio.
This allows them to proactively plan the necessary marketing measures to extend the life cycle in phases where profits and market shares reach their highest point.
If you’re looking for a comprehensive breakdown of the PLC, look no further.
This article will cover:
- What is the Product Life Cycle?
- The Boston Consulting Group (BCG) Matrix
- Factors influencing the Product Life Cycle
- Conclusion
What is the Product Life Cycle?
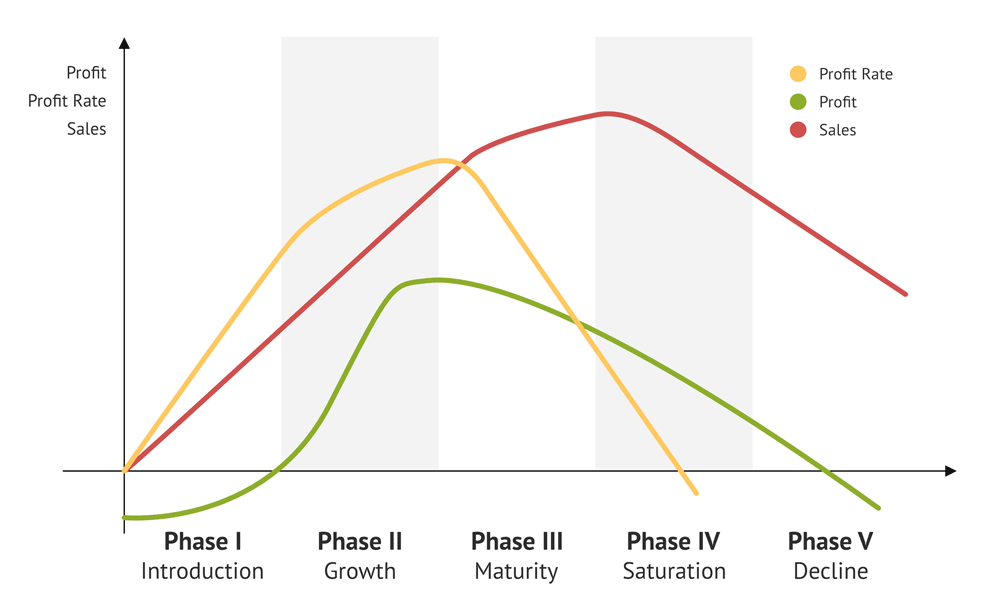
The basic model of the product life cycle defines five different phases that a product passes through from market launch to eventual market exit:

Phase 1: Introduction
The first phase describes the market launch, which begins with the market entry of the product. From this point on, the product can be purchased by customers.
During the market launch phase, advertising the product is an integral part of a successful and sustainable marketing strategy to ensure consumers become aware of the new offer.
Managers must put special emphasis on explaining those products whose added value or function is not immediately clear to the customer.
Depending on the industry, product type and marketing strategy, products are often advertised before the actual sales launch and sometimes even offered for pre-order.
The video games industry is an example where companies have long adopted pre-sales processes to build customer anticipation before releasing a product. FMCG companies, on the other hand, make little to no use of such pre-order sales models.
The market launch phase is cost-intensive and thus negatively affects a firm’s profit curve. The reason for that is simple:
Companies must first invest more money in marketing activities than they can earn with the new product. Once the company starts to realize more sales, profits also start to rise, resulting in a positive profit ratio.
The end of the market introduction phase is marked by reaching the break-even point. The point from which the sales revenue cover the cost of selling the product.
Break-Even = Sales x Price – Sales x Variable Costs – Fixed Costs = 0
Note that not every product reaches the next phase of the life cycle. Many products already fail after their launch and/or never break even.
Phase 2: Growth
The following growth phase is characterised by a continuous increase in sales as more and more customers buy the product.
The growth phase is crucial for brands as they gain momentum and start to realize their first profits. Their focus then shifts from pure marketing to meeting demand forecasts to ensure they remain available across all retail channels.
In this phase, competitors also become increasingly aware of the product in question. If they see an attractive market entry opportunity, they will launch their own versions of it. This may result in price wars and imitations, which can harm the long-term success of the product.
Phase 3: Maturity
When the maturity phase is reached, the strong growth curve from the previous stage begins to flatten.
Most products reach their most profitable state in the maturity phase, as they are now established in the market and therefore no longer need to be promoted so heavily.
In the maturity phase, growth is achieved almost exclusively by poaching customers from competing products in the industry.
Brands need to continuously build and focus on their own brand and marketing messages to not fall victim of these approaches themselves.
Phase 4: Saturation
A decline in turnover and profits characterises the following saturation phase. Market growth completely ceases to exist.
Instead, companies strive for cost leadership in their industry. The aim is to offer products cheaper than other market participants to increase profits while sales stagnate.
If cost leadership is achieved and successfully sustained, the saturation phase allows firms to secure their market share and withstand competitors’ attempts to initiate price wars in their industry.
Phase 5: Decline
Finally, the product life cycle ends in the degeneration phase. It is characterised by an increasing loss of profit, turnover and market share, which can no longer be compensated for by a firm’s marketing efforts.
The focus in this phase is to bring innovations to market that satisfy the current needs of customers.
The FMCG industry is a great example in which companies are constantly launching new product features to revive their products’ life cycle: Razors get more blades, and snack bars launch with new flavours based on seasonal customer trends.
When the degeneration phase is reached, the basic model of the product life cycle ends; the product “dies”.
The Boston Consulting Group (BCG) Matrix
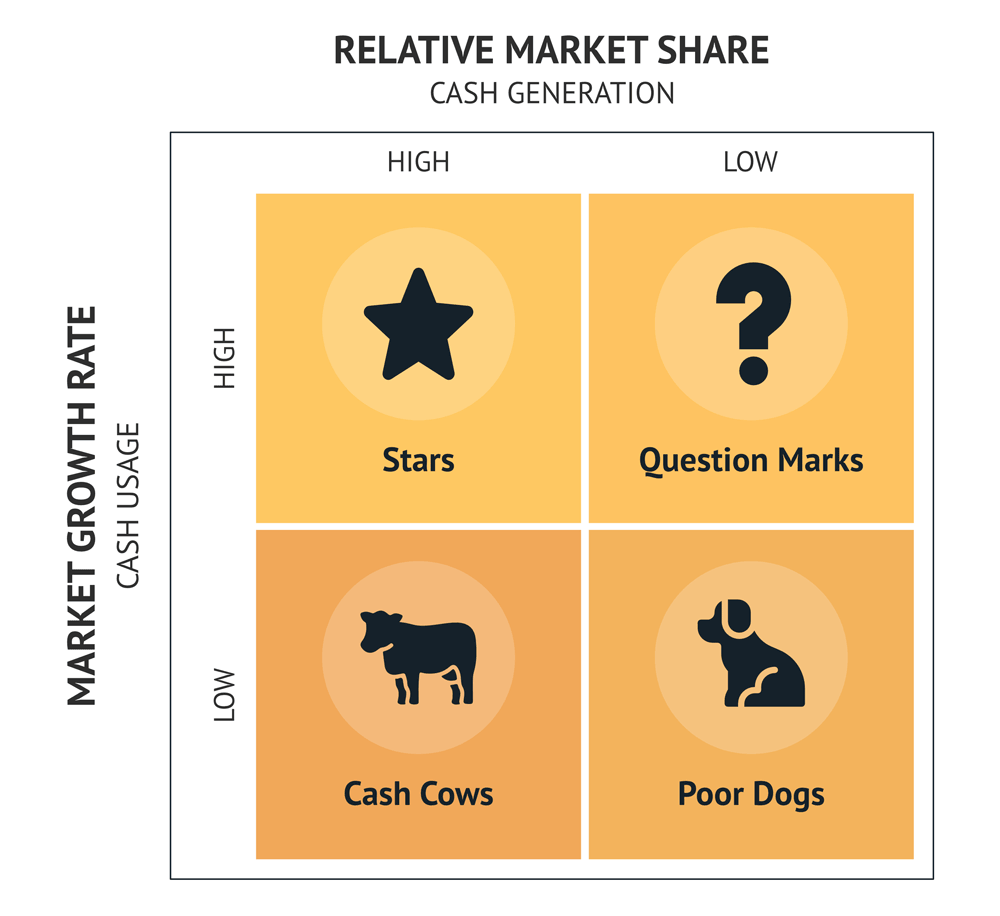
Based on the basic product life cycle model above, the Boston Consulting Group developed its own BCG Matrix. It aims to identify the strategic potentials of a company’s existing product portfolio.

A core component of this analysis is to determine, in which of the four life cycle quadrants (stars, question marks, cash cows, poor dogs) a product is currently situated.
Companies can measure this by looking at the existing market growth and relative market share of their product.
Market growth = ((Current market size – Original market size) / (Original market size)) * 100
Relative market share = (Market share of a company / Market share of its strongest competitor ) * 100
Due to its strategic and quantitative orientation, the BCG matrix has become the preferred choice for companies to monitor the product life cycle over time.
Stars
Products with a high relative market share and high market growth are referred to as Stars.
Managers should invest in products within this quadrant to benefit from the fast-growing market segment for as long as possible and to enable further growth.
Question Marks
A product in the Question Mark stage has a low relative market share and high market growth. At this stage, products have usually just entered the market.
The question mark quadrant corresponds to the market introduction phase of the basic PLC model explained earlier. Further growth in relative market share is again achieved through investments in marketing activities.
Cash Cows
As soon as market growth slows down, but high relative market shares continue to be recorded, products are referred to as Cash Cows.
These products continue to generate substantial profits due to lower cost structures and represent the most profitable quadrant of the BCG matrix.
However, similar to the maturity phase of the basic PLC model, a higher market share can now only be achieved by poaching customers from existing customers. The market is saturated.
Poor Dogs
At the end of the product life cycle, products in the low market growth and relative market share range are referred to as Poor Dogs.
They are the problem products within a product portfolio and increasingly generate losses.
In this stage, the market exit or a product relaunch must be carried out to sustainably improve the financial situation of the product line.
Factors influencing the Product Life Cycle
Regardless of whether the basic PLC model or the BCG matrix is used: The length of the product life cycle varies from product to product.
Companies can influence the product life cycle through clever pricing, branding campaigns, and after-sales activities.
But it’s not all driven by internal factors.
Changes in the political, legal or economic context can also influence the product life cycle just as much as the sudden market entry of competitors or substitute products.
Conclusion – The Product Life Cycle as a strategic planning tool
The key advantage of the product life cycle is that its concept can easily be applied to the real world.
Businesses can evaluate their product portfolio using either the basic PLC model or the BCG matrix, taking into account market data and internal data points.
Depending on which phase a company’s individual products are in, marketing investments must be made, or new products must be researched and developed with the foresight to avoid a loss of sales.
The concept of the product life cycle can also be used to define specific recommendations for forward-looking marketing tactics. Yet, decision-makers should always take a holistic view in such an analysis.
This is because the changing market conditions also have a direct and indirect impact on the lifecycle stages of their products.
Need help managing your products’ life cycle?
If you want to better understand the sales performance of your business, get in touch. I offer tailored advice to help you assess your ecommerce selection and increase your sales.
—
Enjoyed this article? Here are more things you might like:
What is Business Strategy? – Increase your chances of success and understand what it takes to build an effective business strategy.
Porter’s Five Forces Analysis – A complete guide to Michael E. Porter’s 5 Forces Analysis to help you assess your competitive landscape.
Ecommerce Glossary – Stop the guessing. My glossary explains every ecommerce term in under 30 seconds.

